Monday and Tuesday
On Monday and Tuesday of this week, we traveled to Grundy Center, New Hampton and Independence to do some WINVEST work. Our task was to conduct neighborhood scoring of the communities. I learned on Tuesday that the purpose of our scoring was to get the communities a grant for neighborhood funding. These three communities had all applied to a Housing and Urban Development (HUD) grant, and it was our job to gather evidence of need for each community. Based on the sections of the community that I evaluated, I think Independence should receive the grant.
We evaluated the following characteristics of the houses based on a good, fair, poor scale:
house condition
lot condition
sidewalk
gutters
roof
siding
landscape
We also wanted to know if there was junk present on the lot, if the image of the house was obstructed, and what was causing the obstruction, if any.
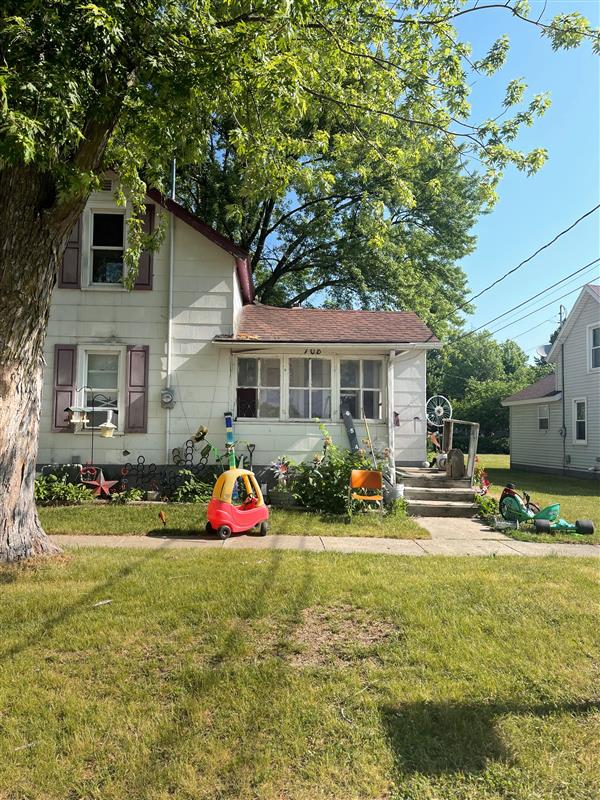
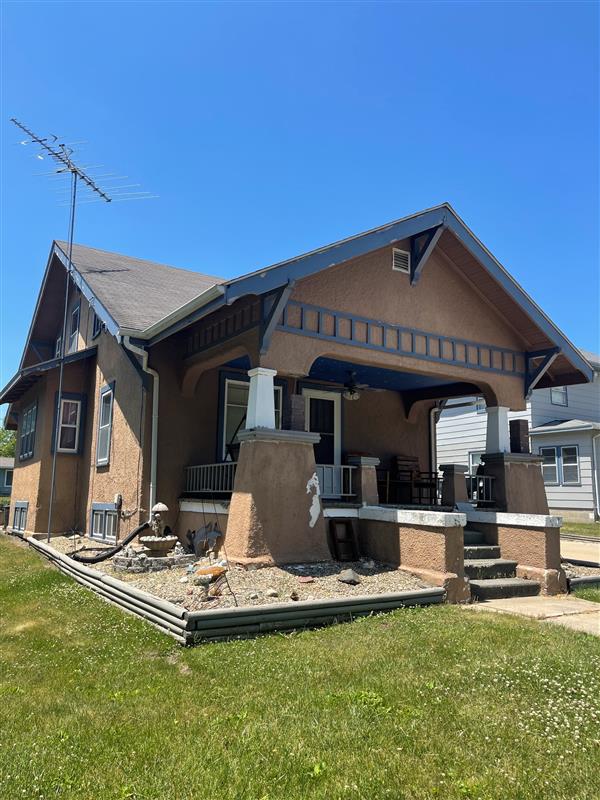
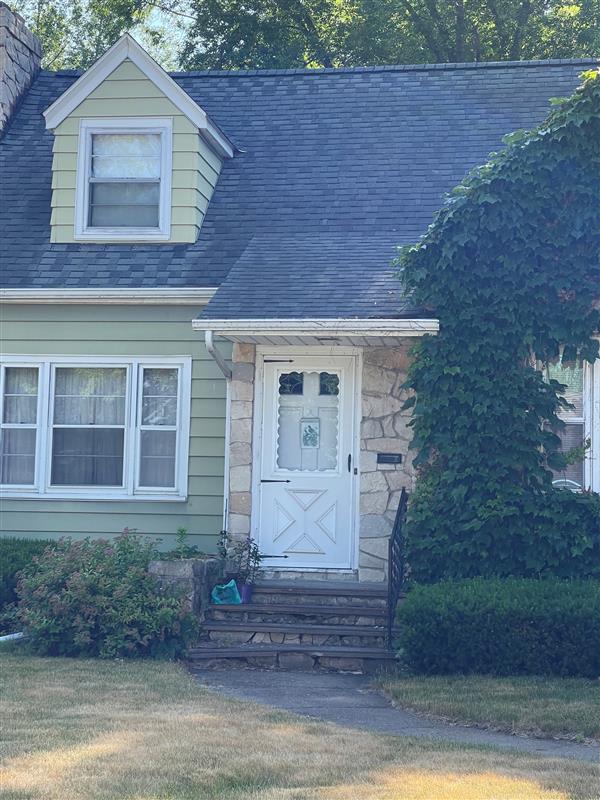
Below are some images I took of particularly low quality houses that I thought our AI Models would benefit to train on.
Wednesday
On Wednesday, I started the demographic profile of Grundy Center, New Hampton and Independence. Morenike, my project leader had requested them, so she could put them in our final report.
I looked at the following characteristics of the communities:
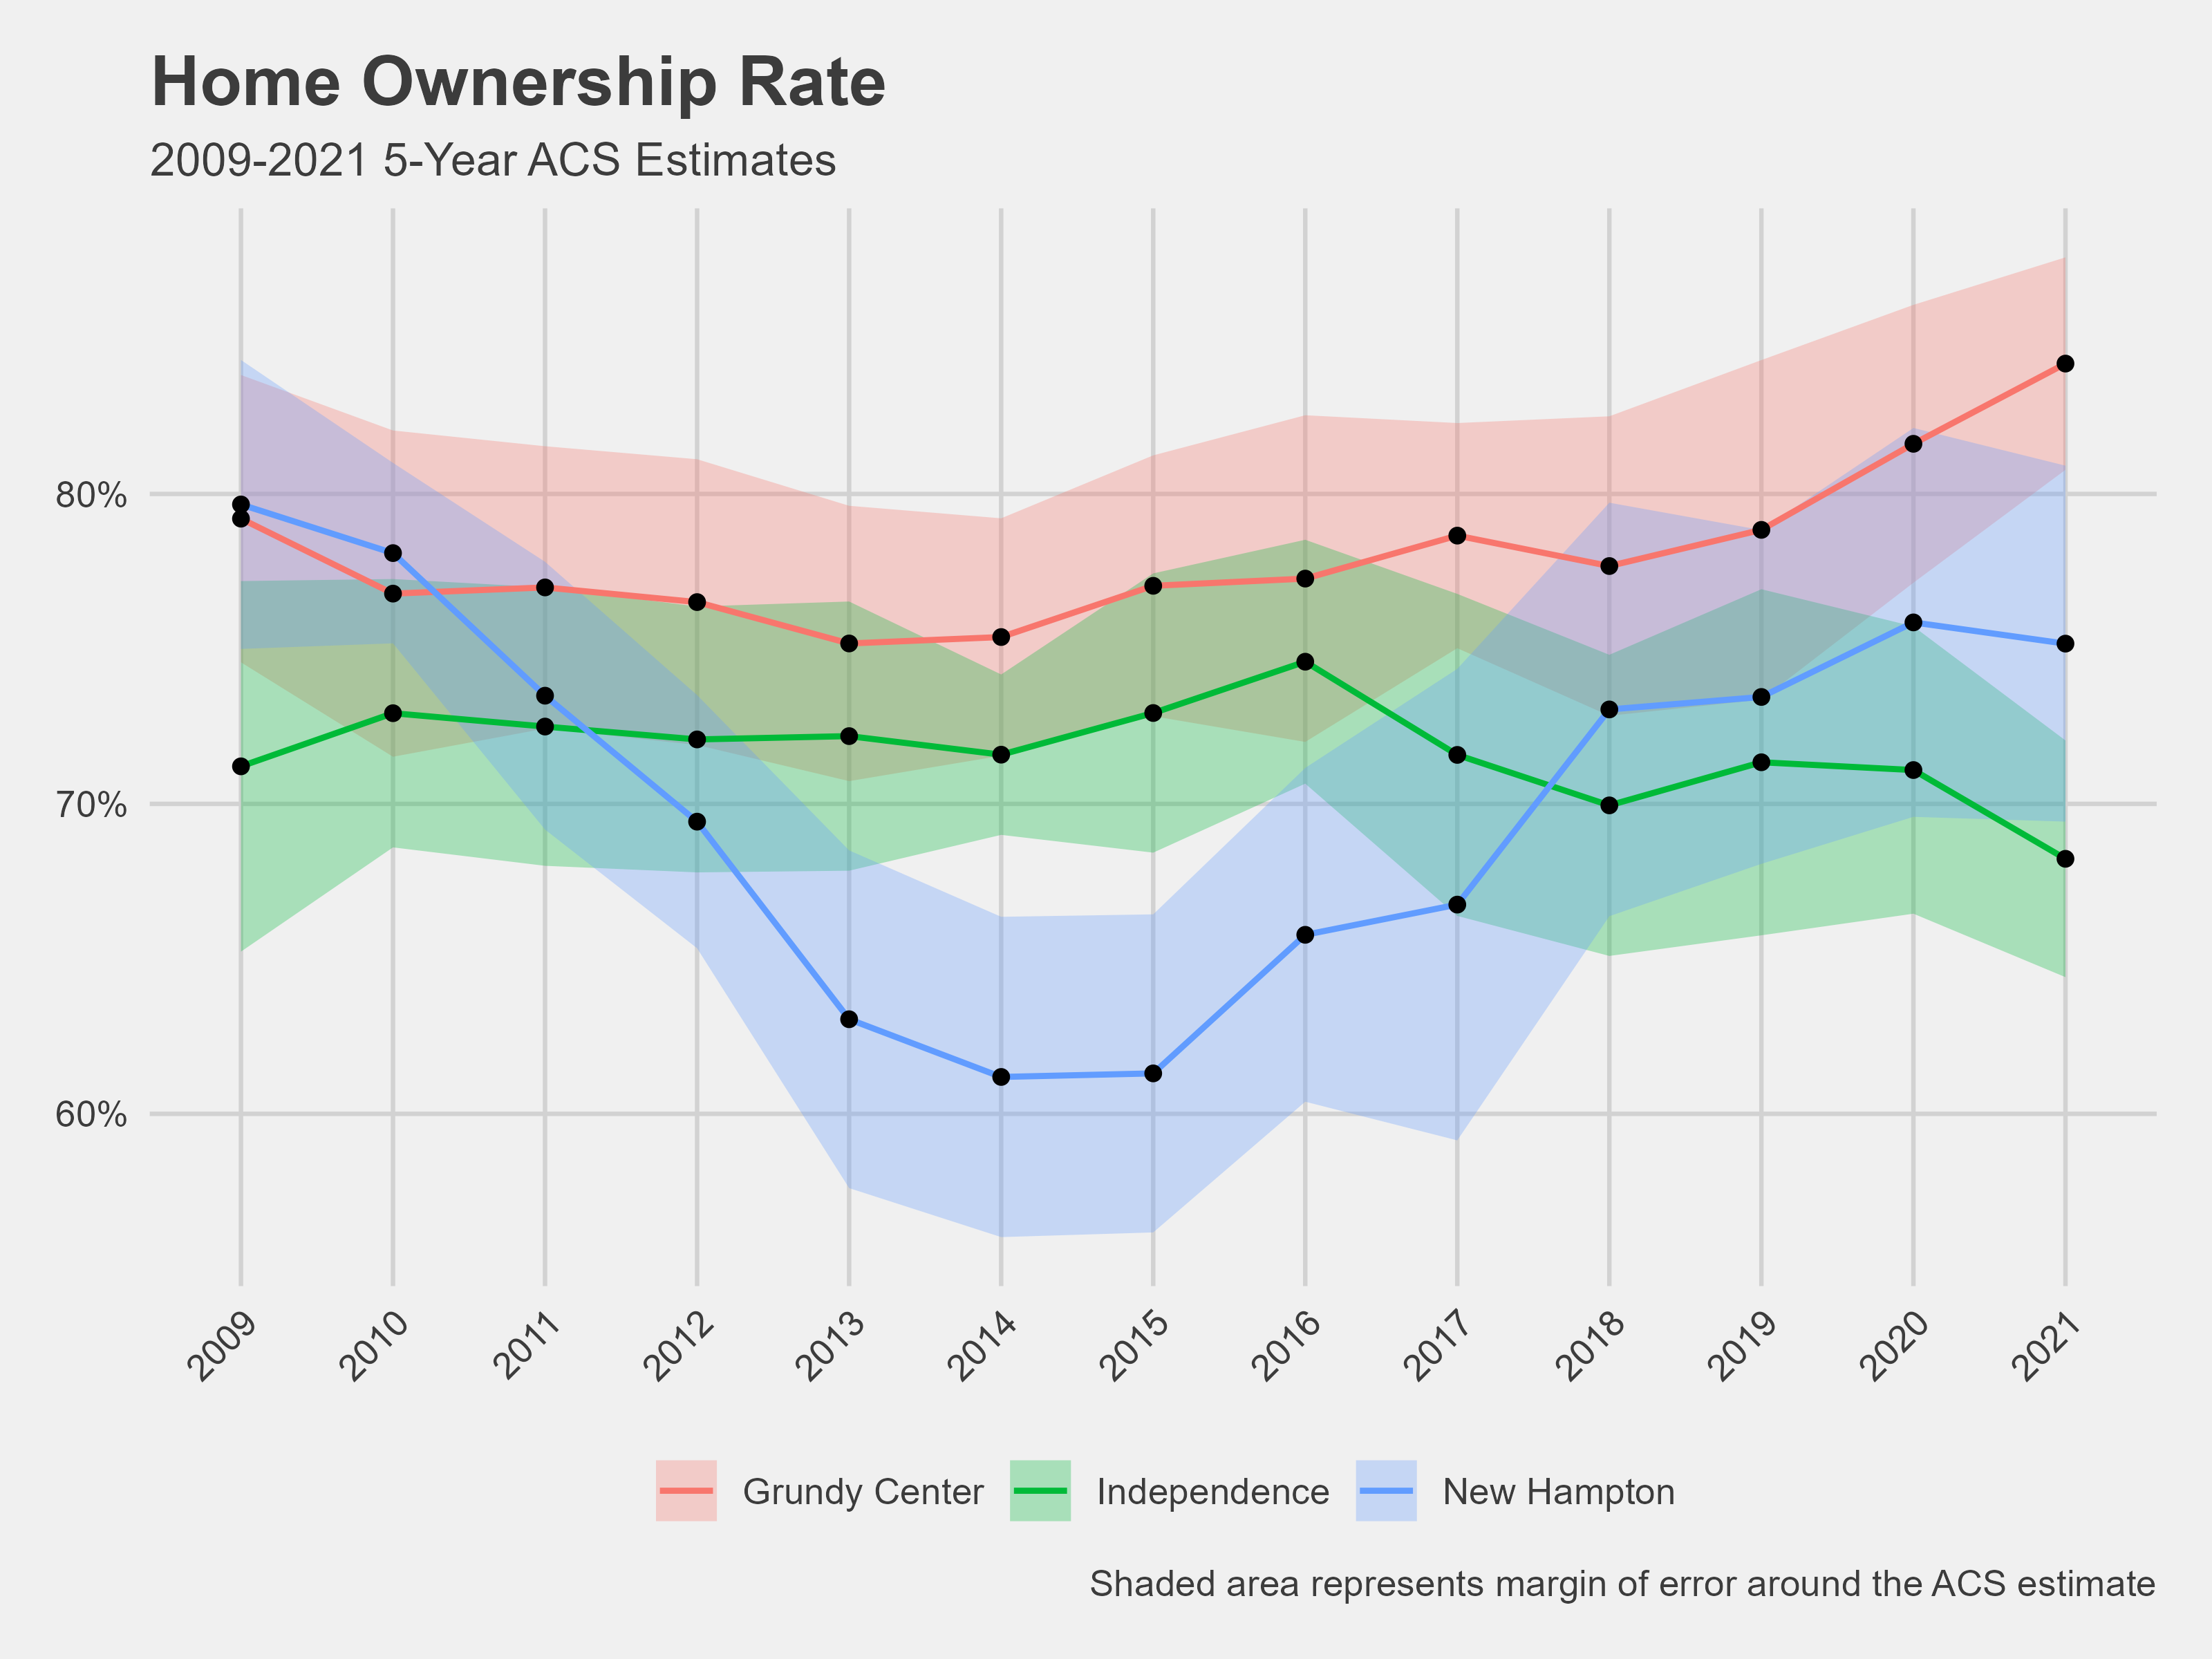
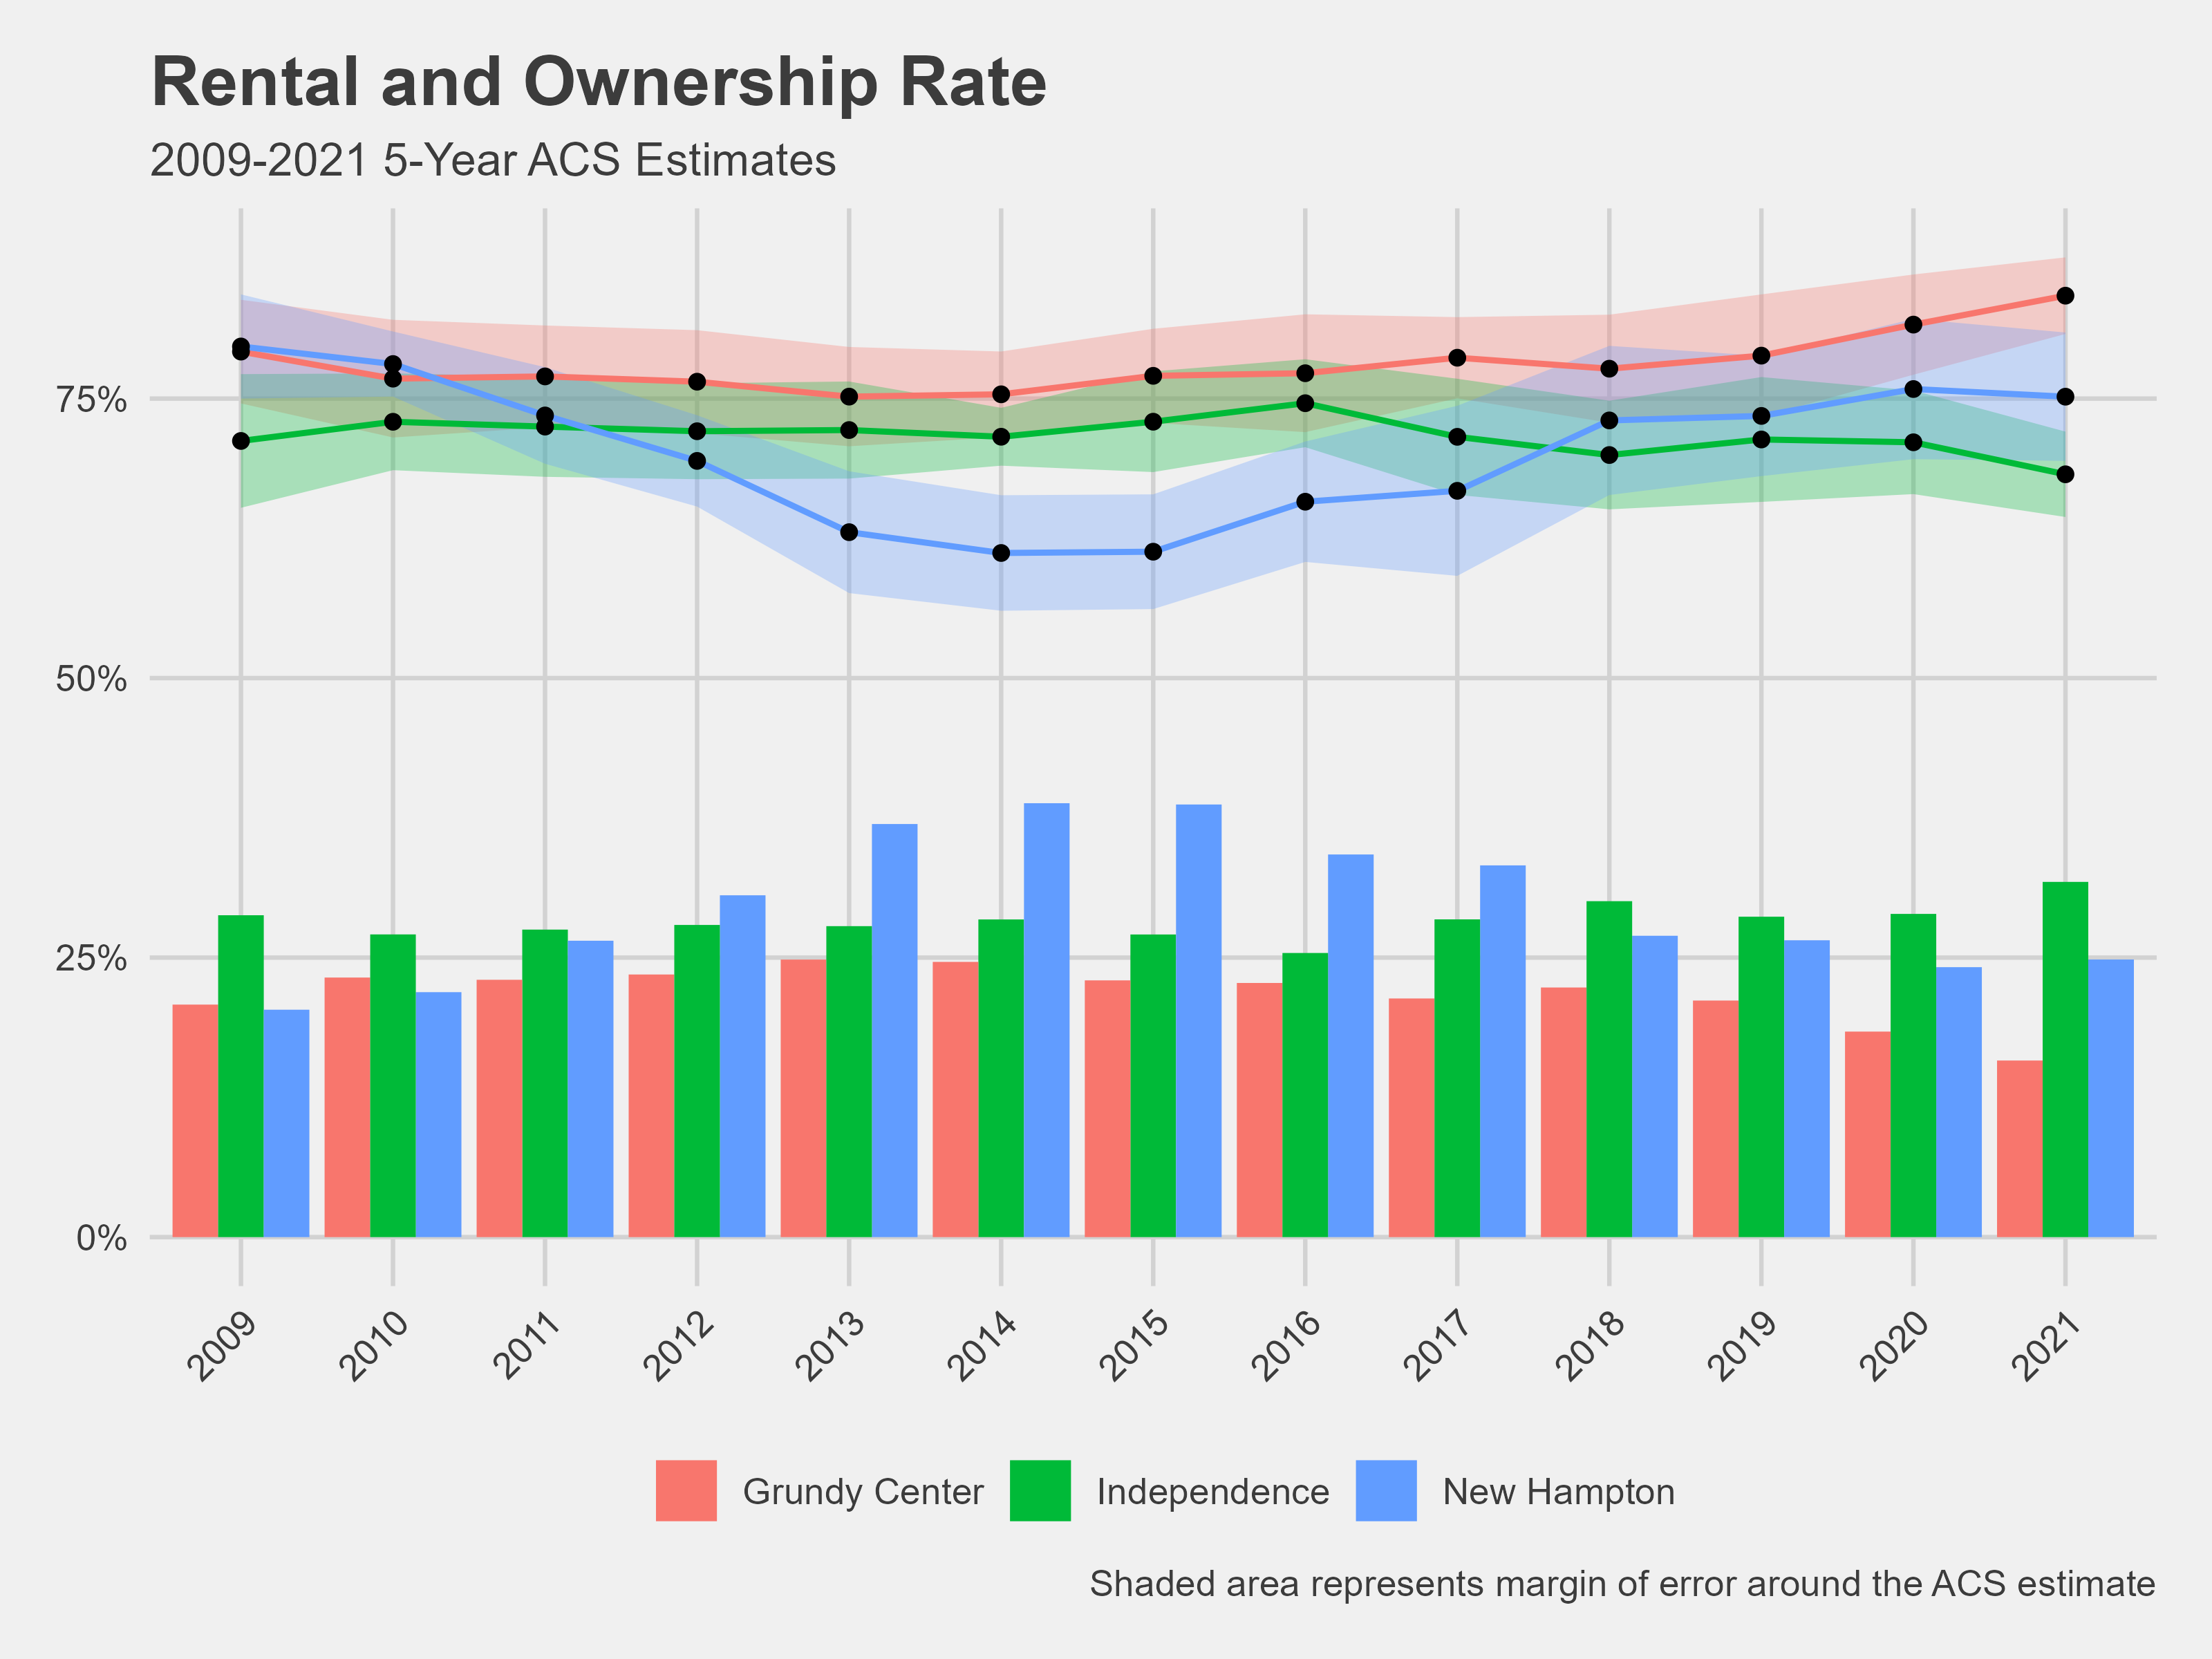
Home ownership rate
Population
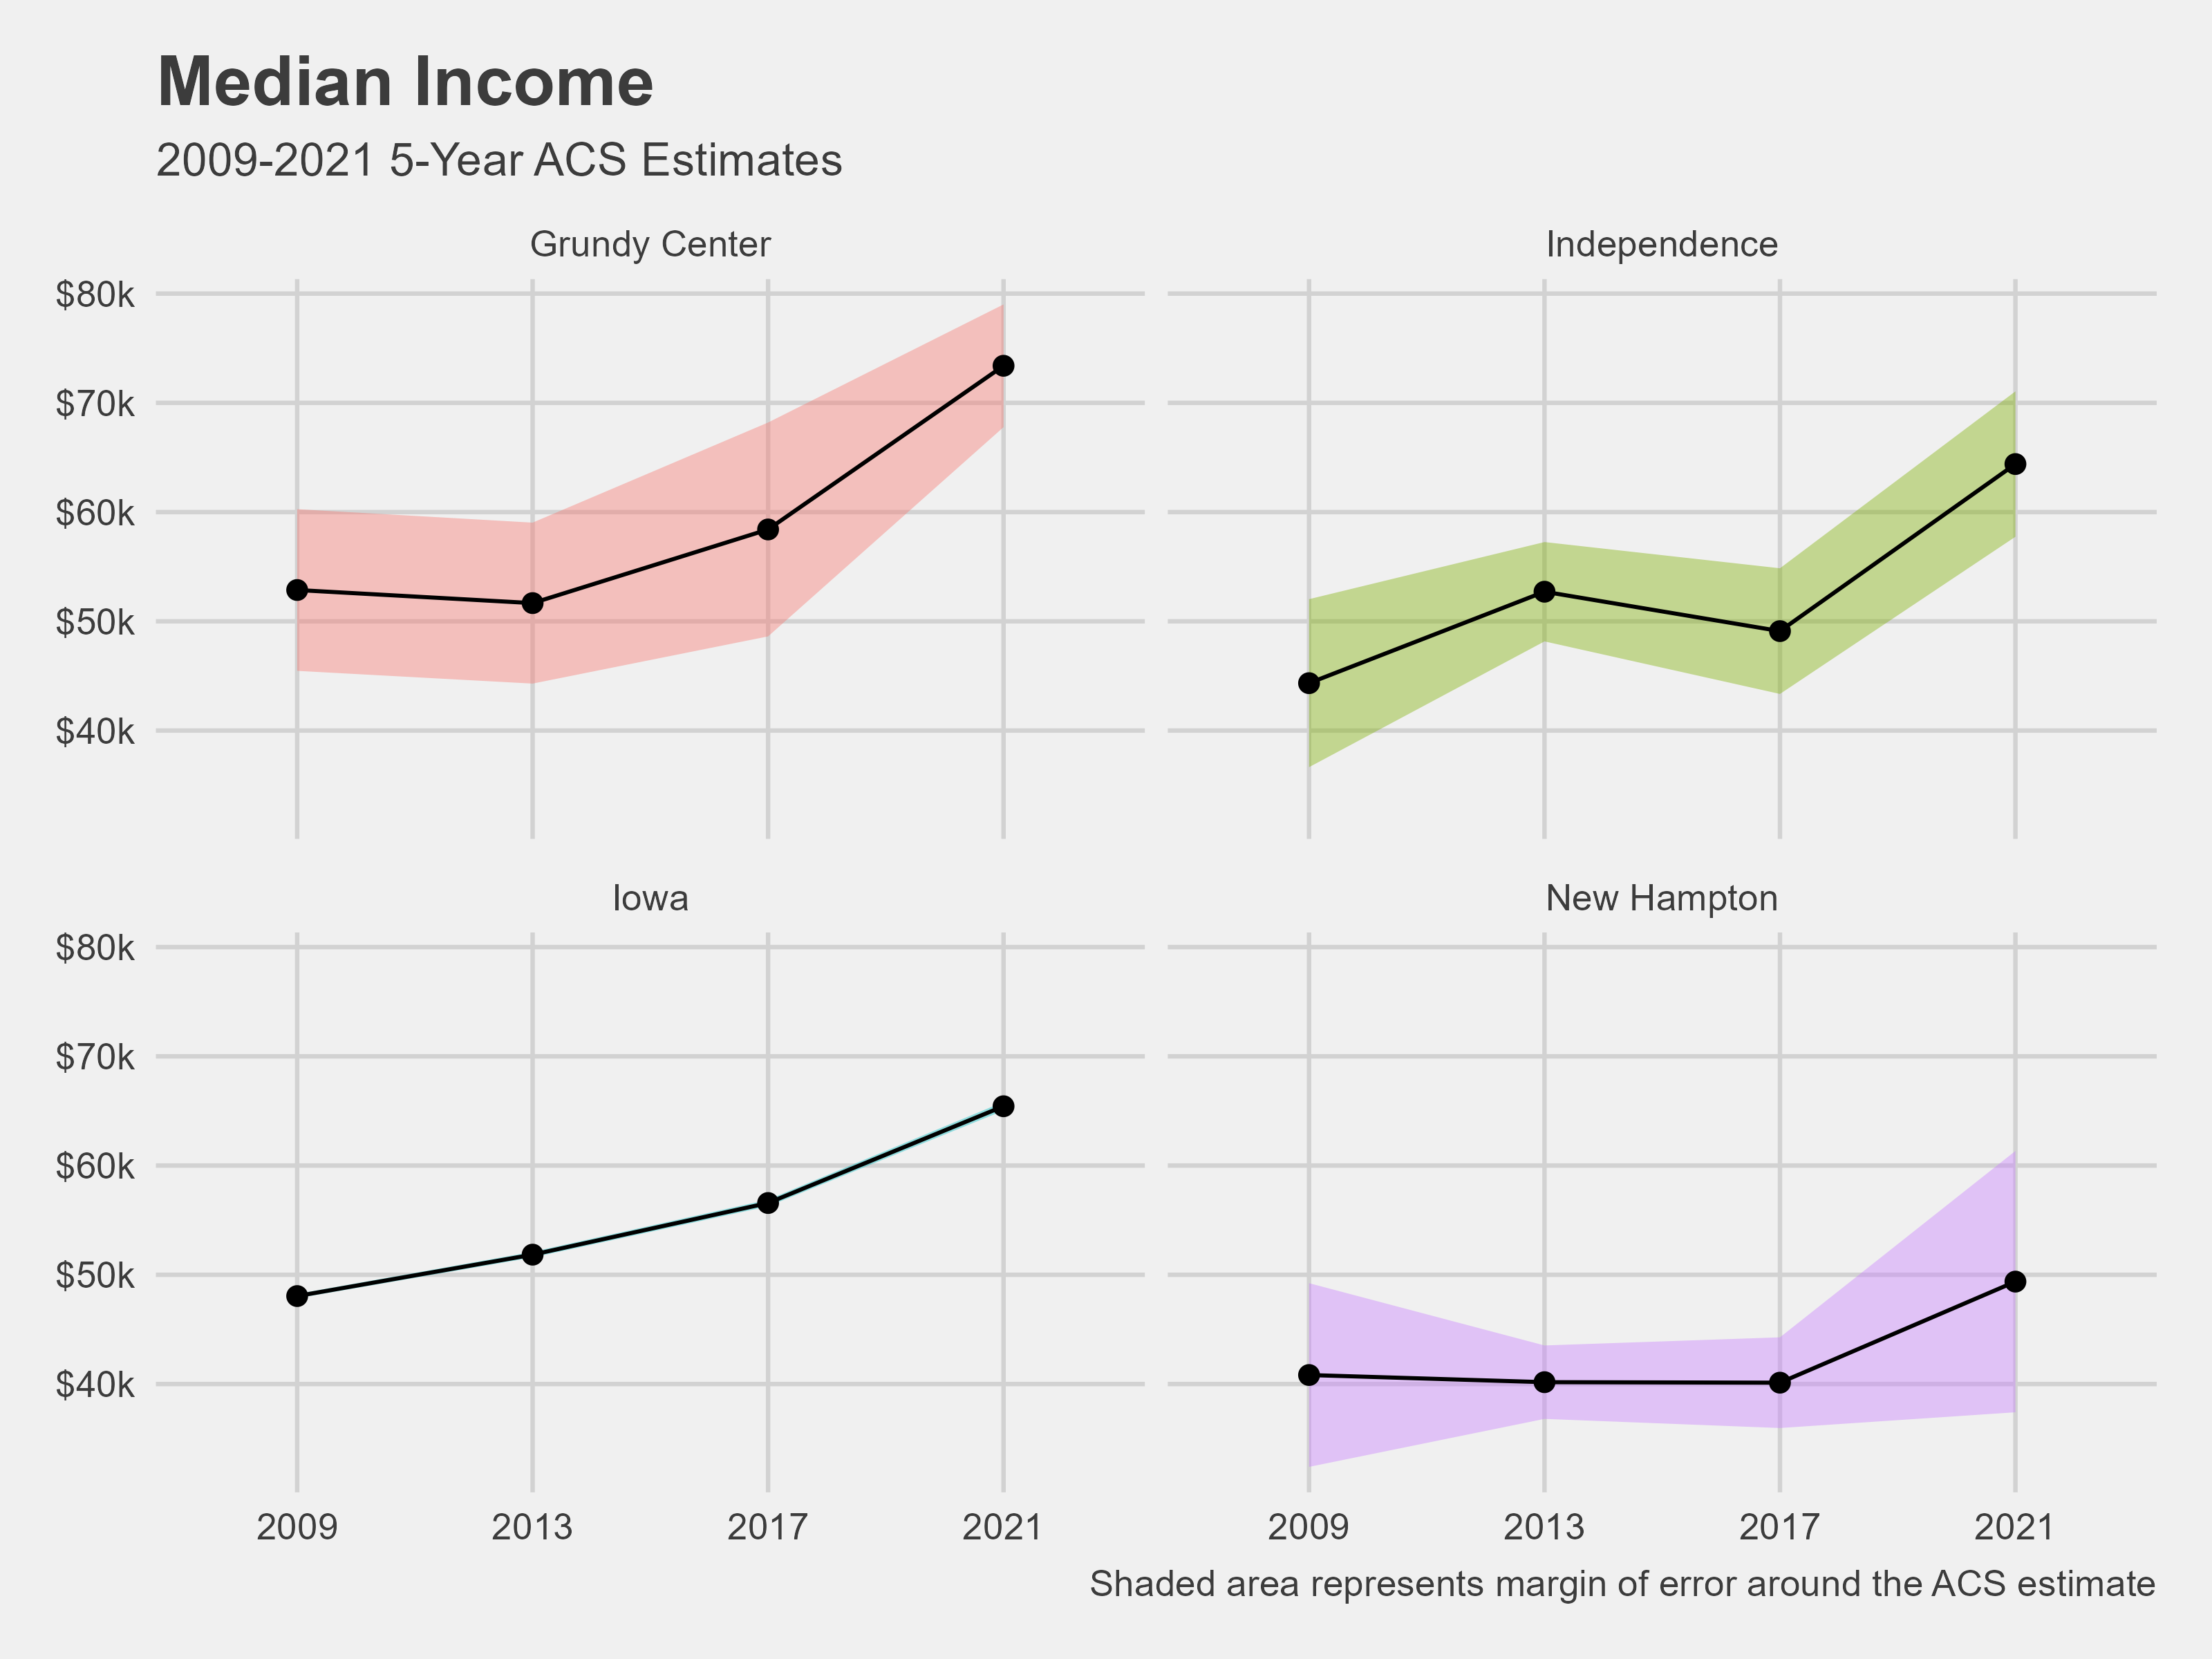
Median income
Age of houses
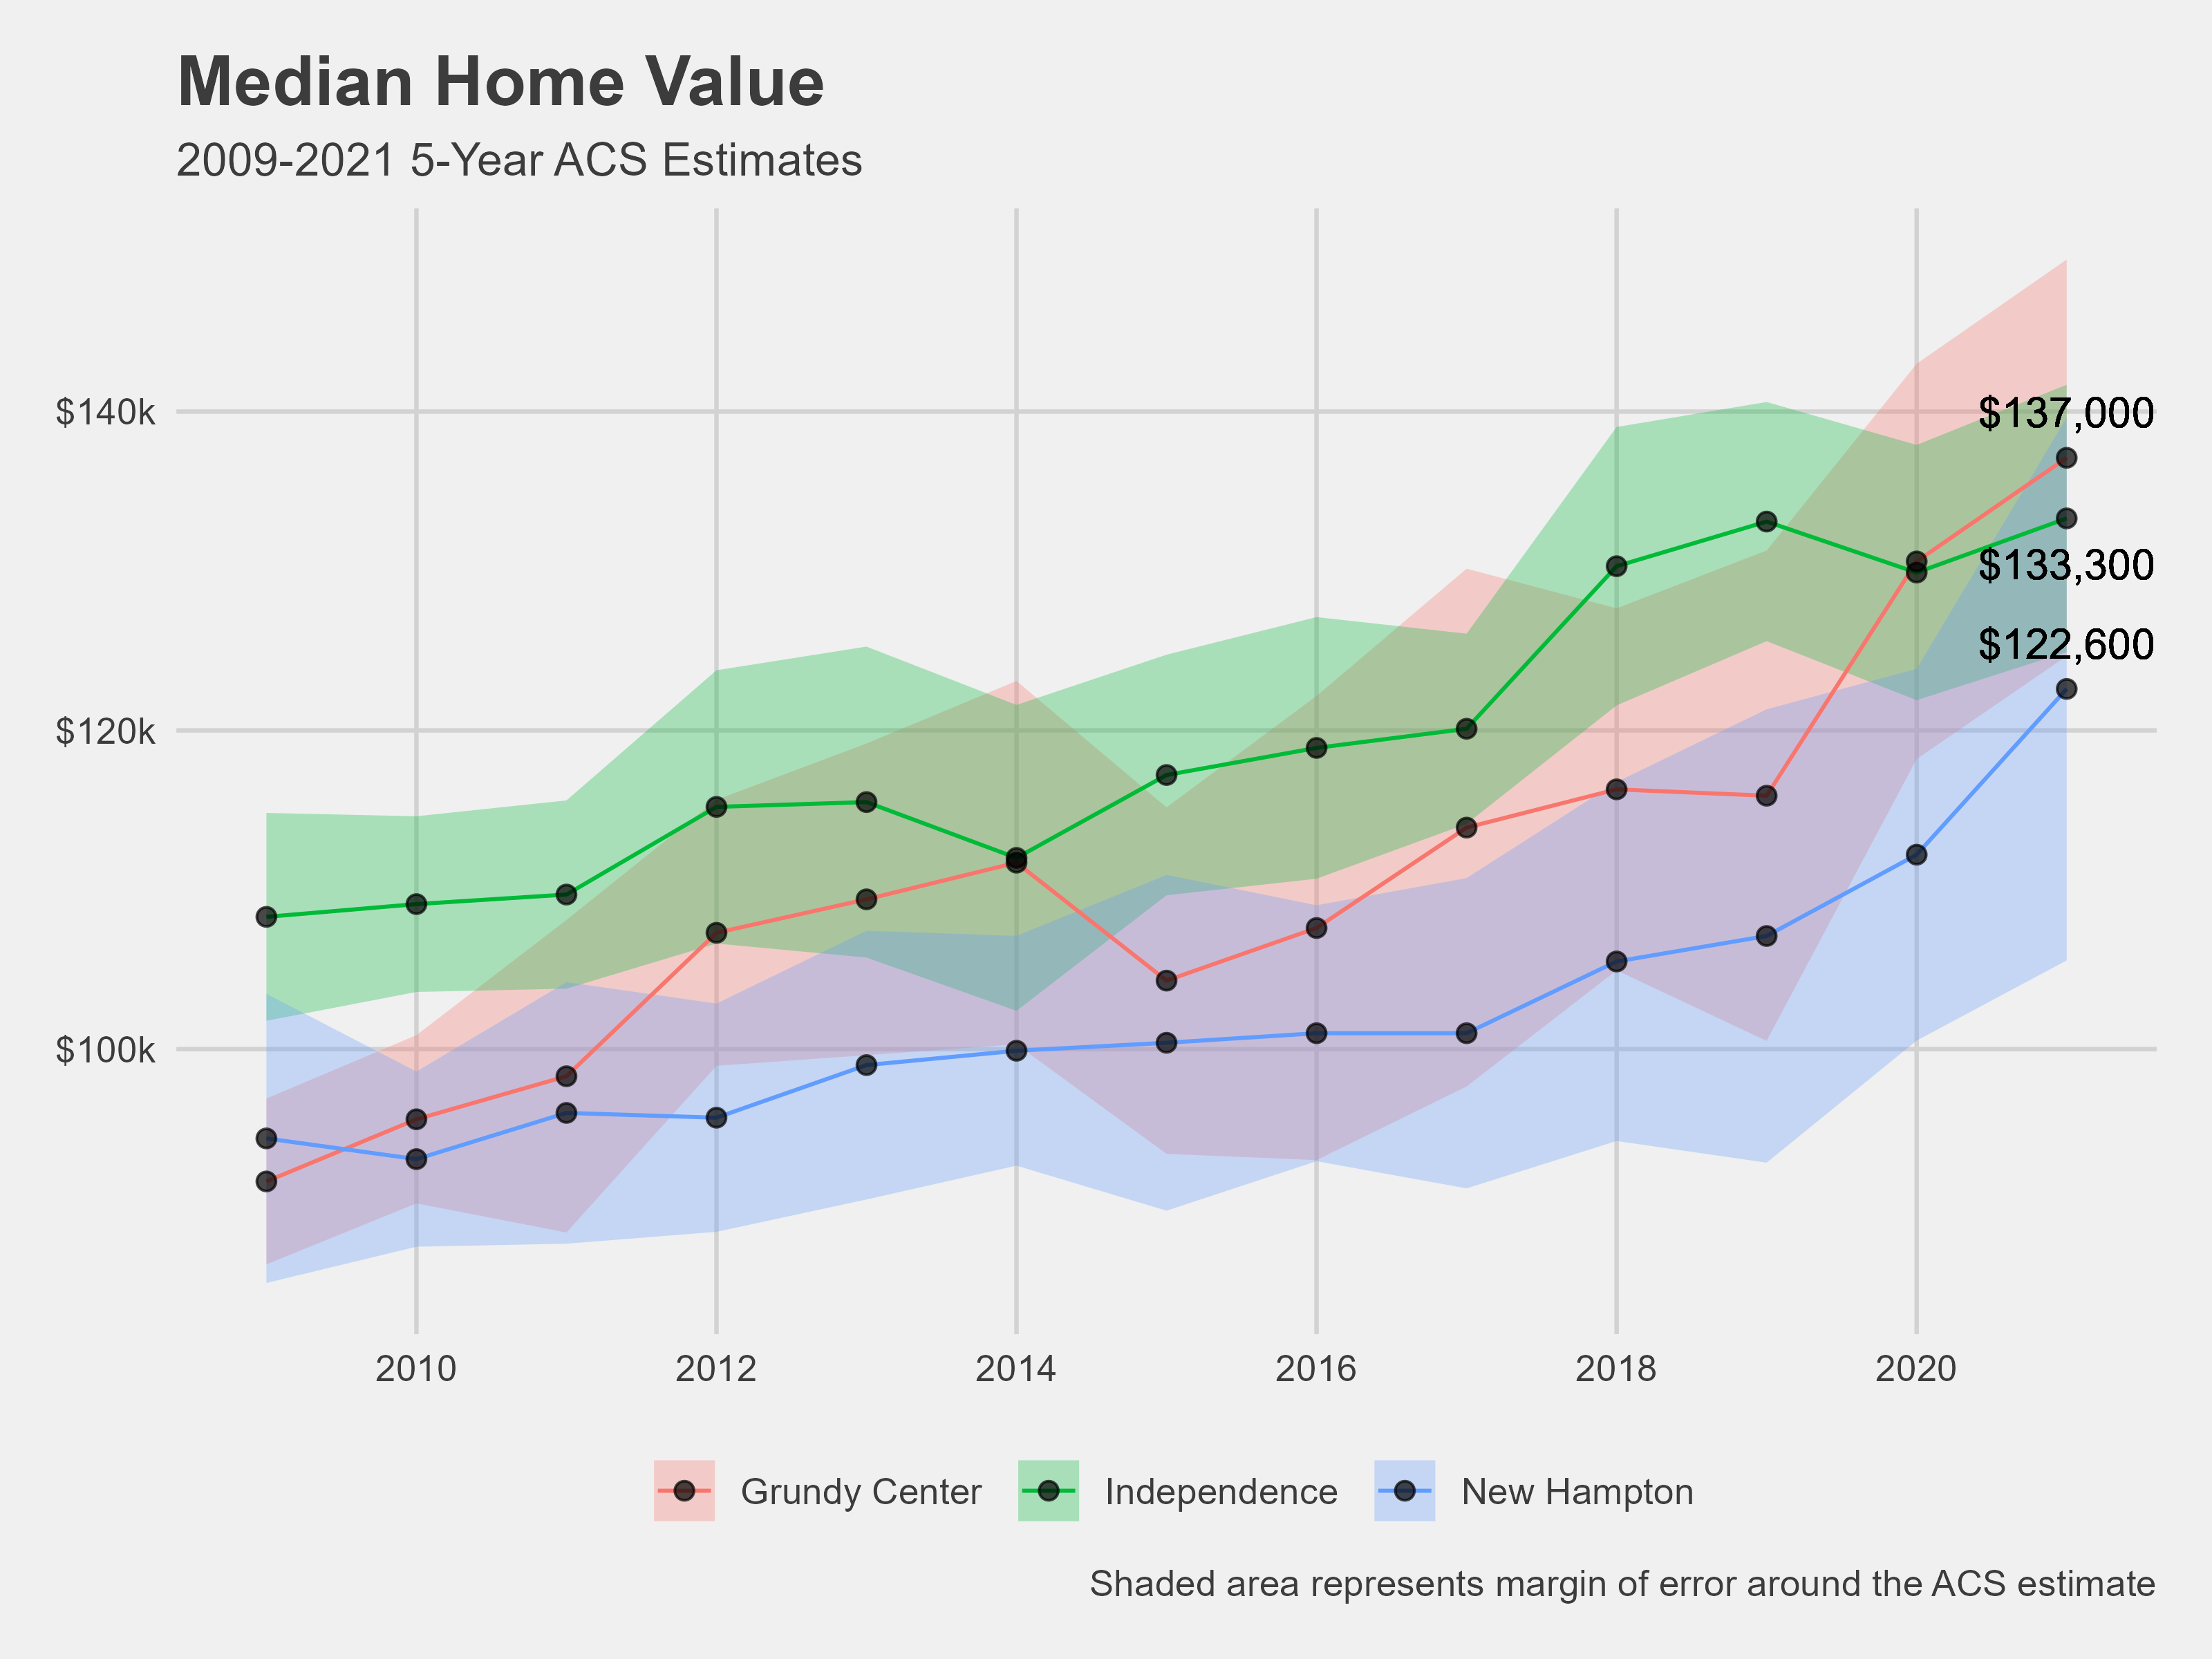
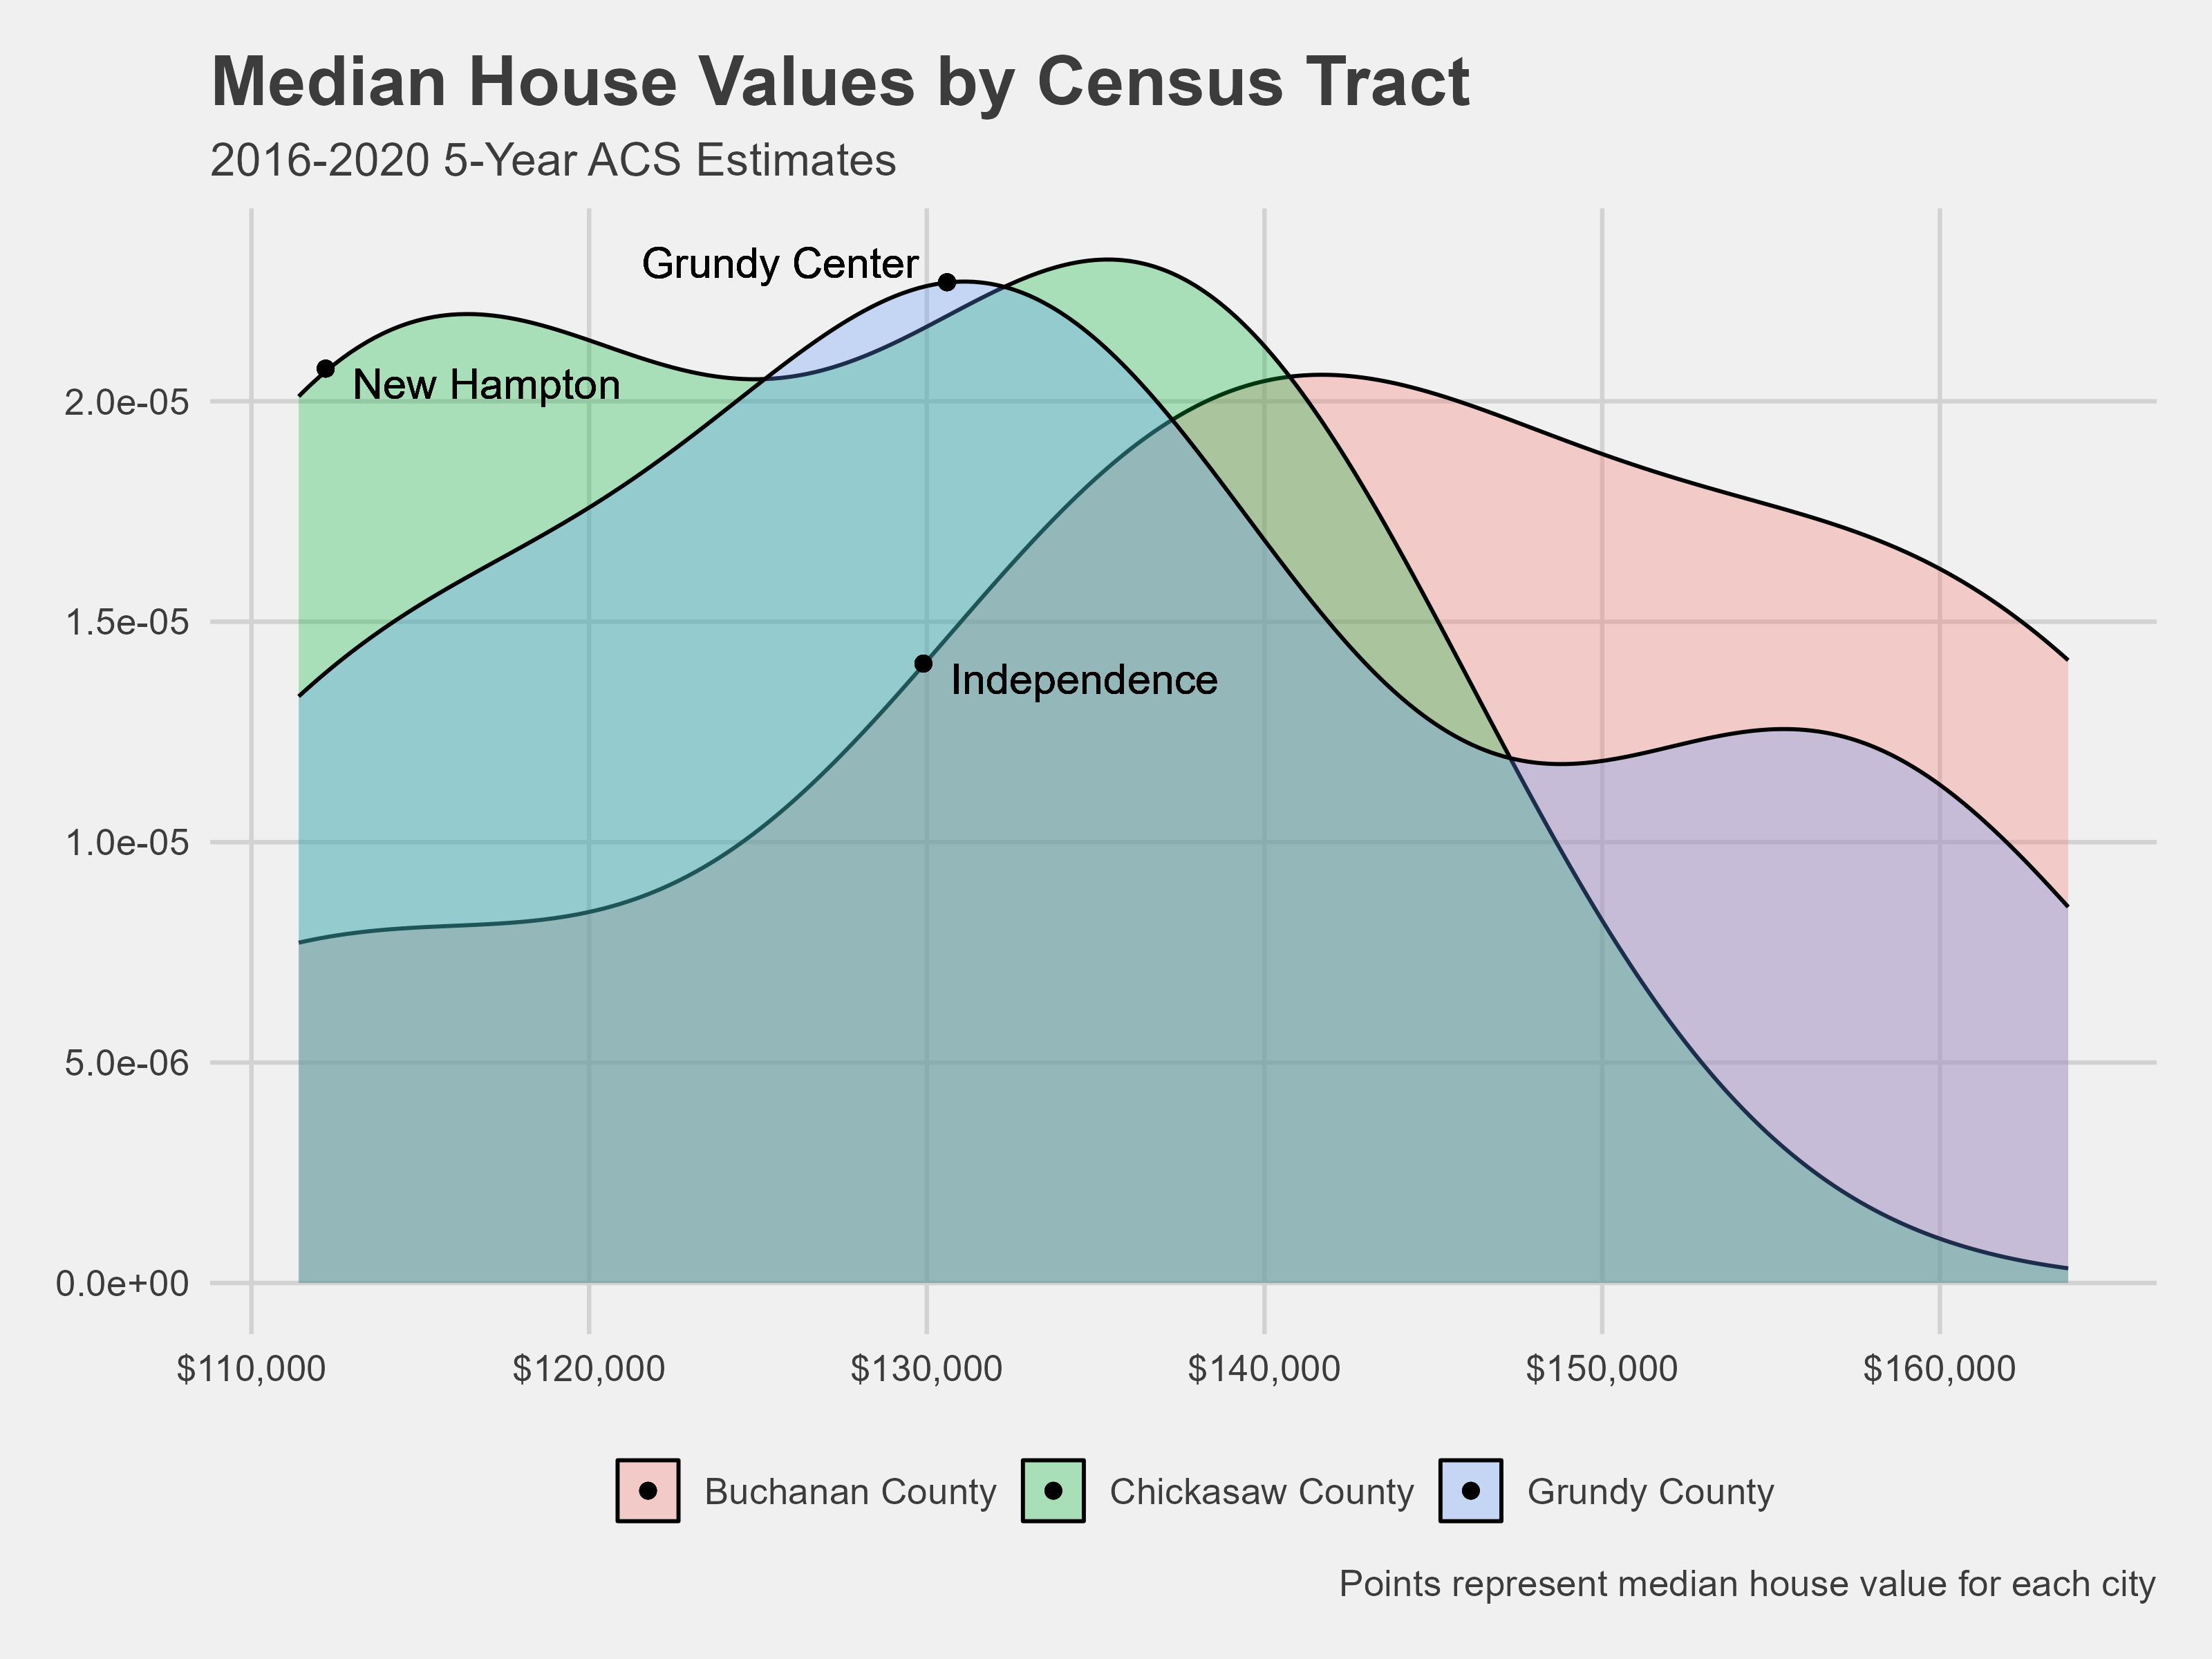
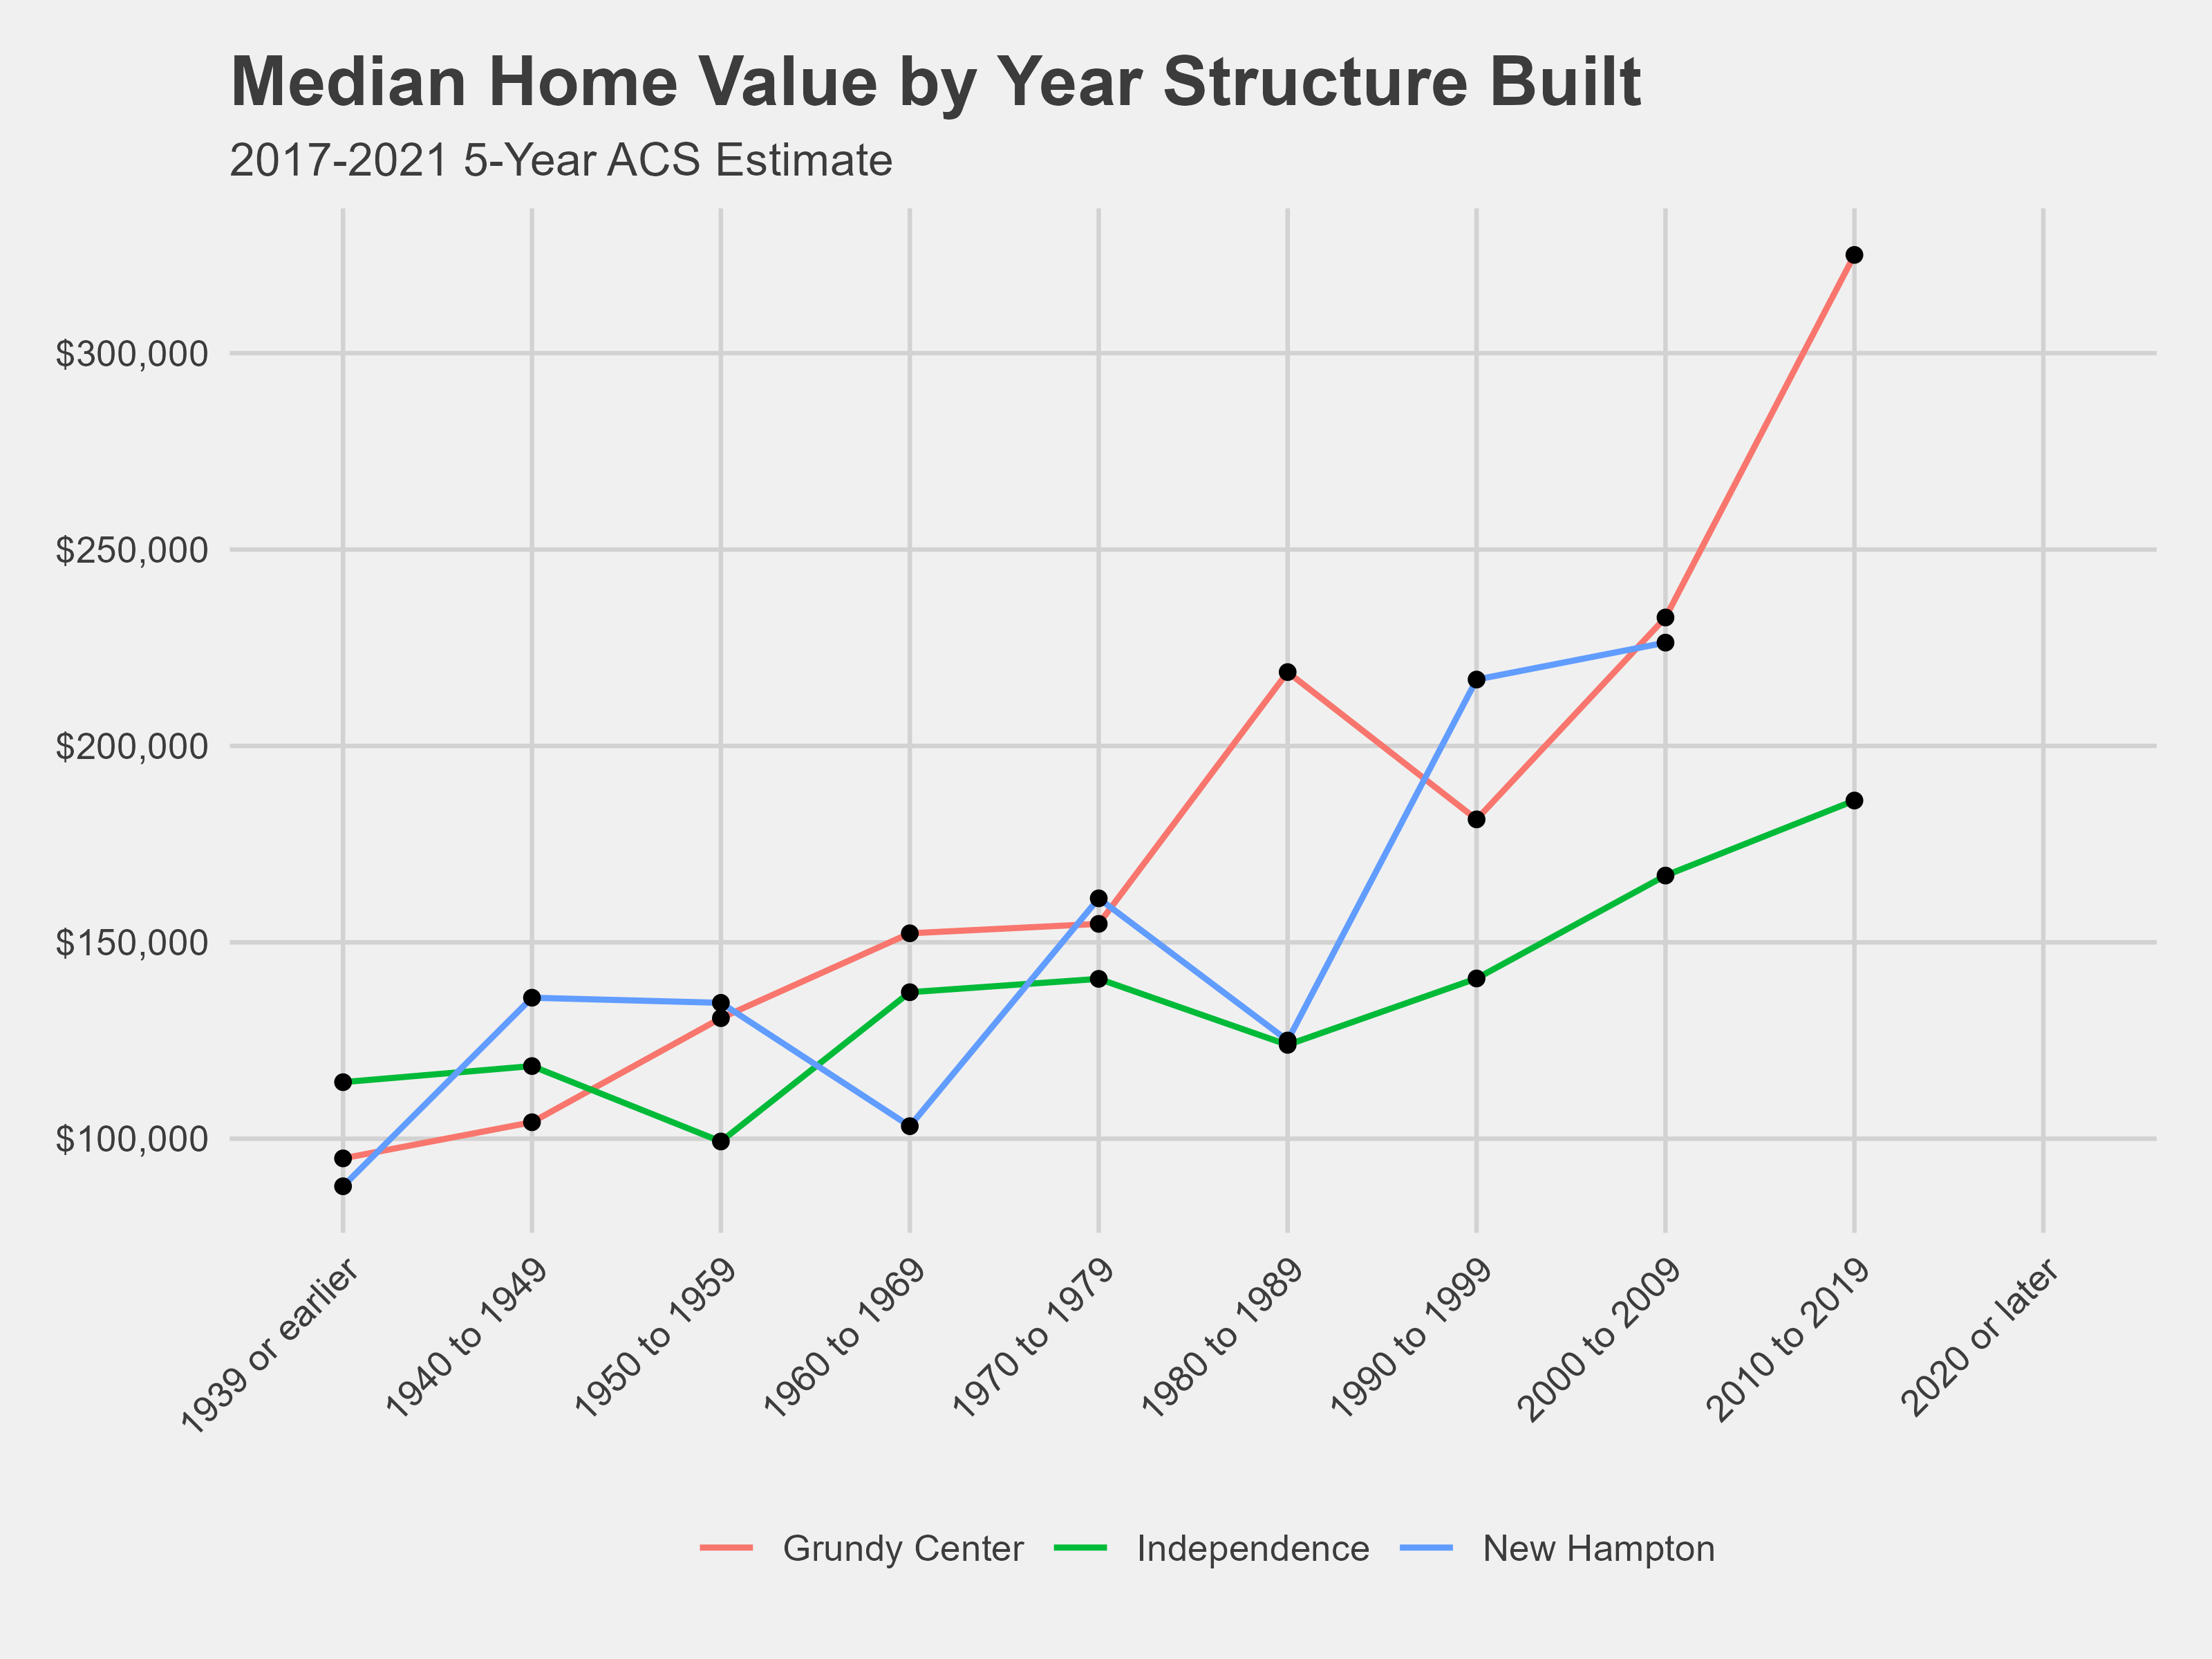
House value
I used 5-Year ACS estimates for all of my plots. The ACS gives more detailed information on demographics of communities. I chose 5-Year over 1-Year estimates because 1-Year estimates are not available for communities under 65,000 in population. 5-Year estimates are also more accurate.
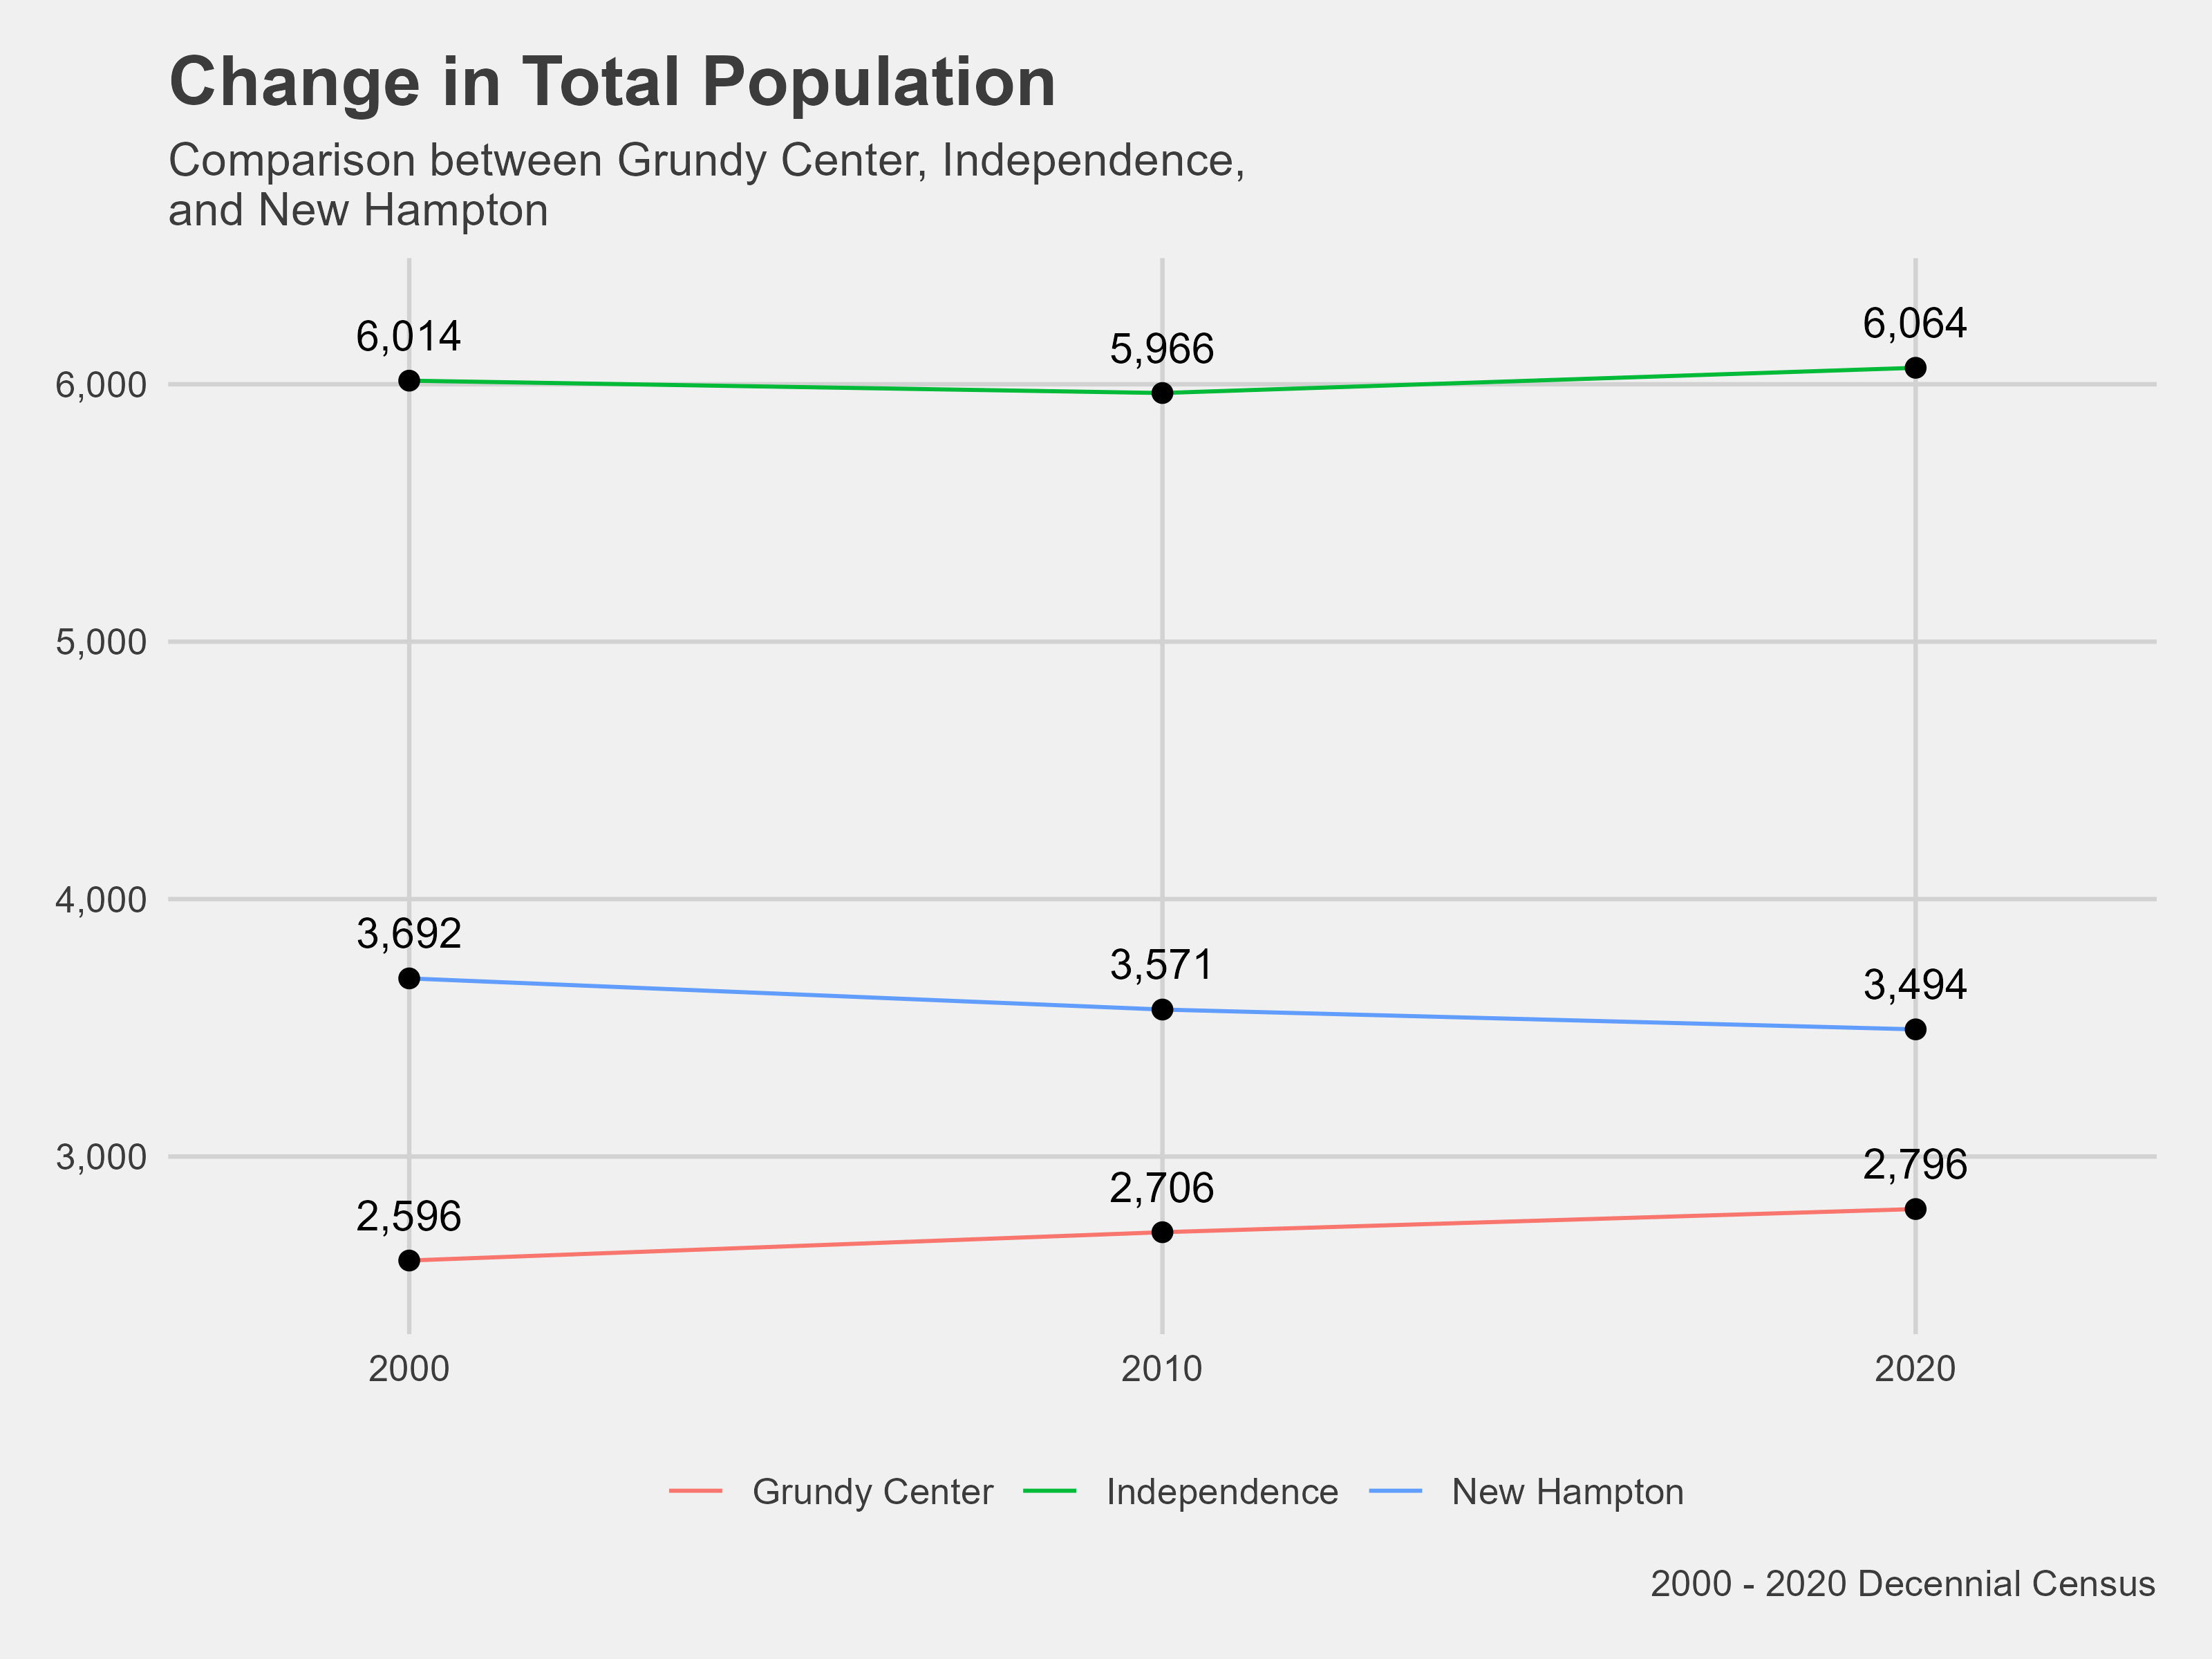
I was able to finish the population plots on Wednesday. I first looked at the total population of each community.
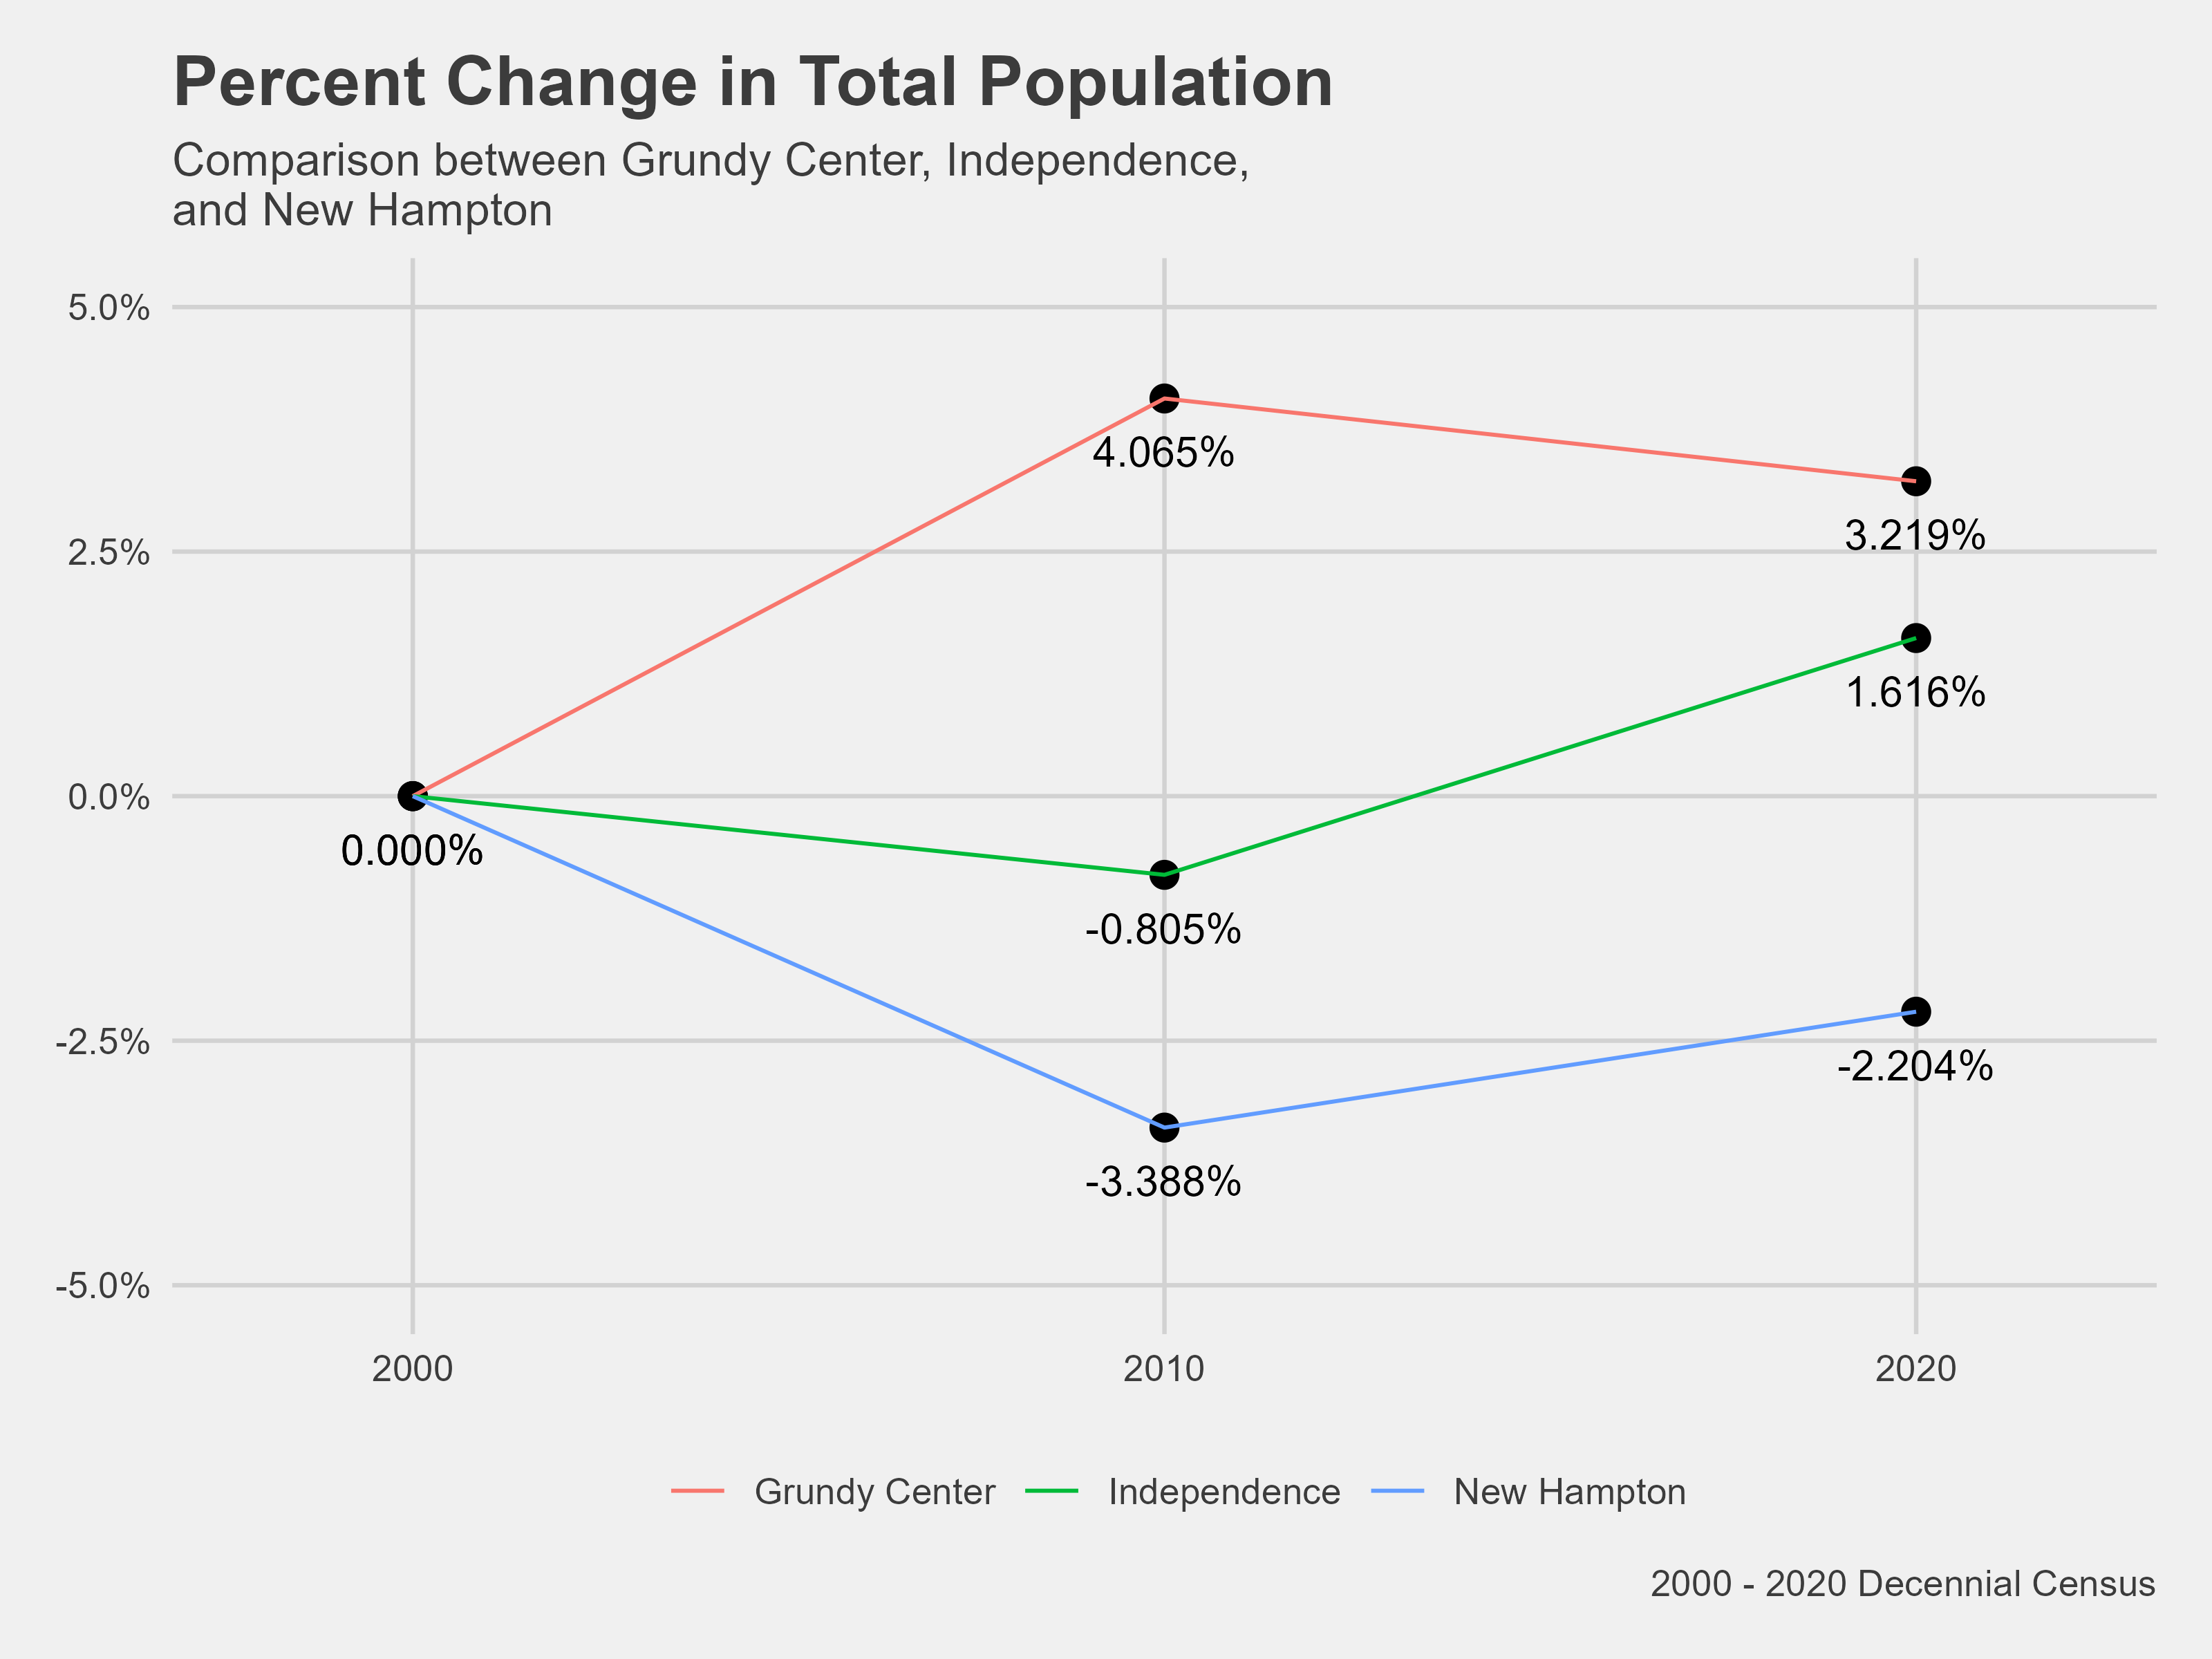
Then I was interested in the percent change in population each community had experienced since 1990. Unfortunately, 1990 Census data has been pulled from TidyCensus. There is a way to access it, but that is not something I had time to explore.
I would like to go back and change this plot so that the 0.0% change for 2000 is not visible.
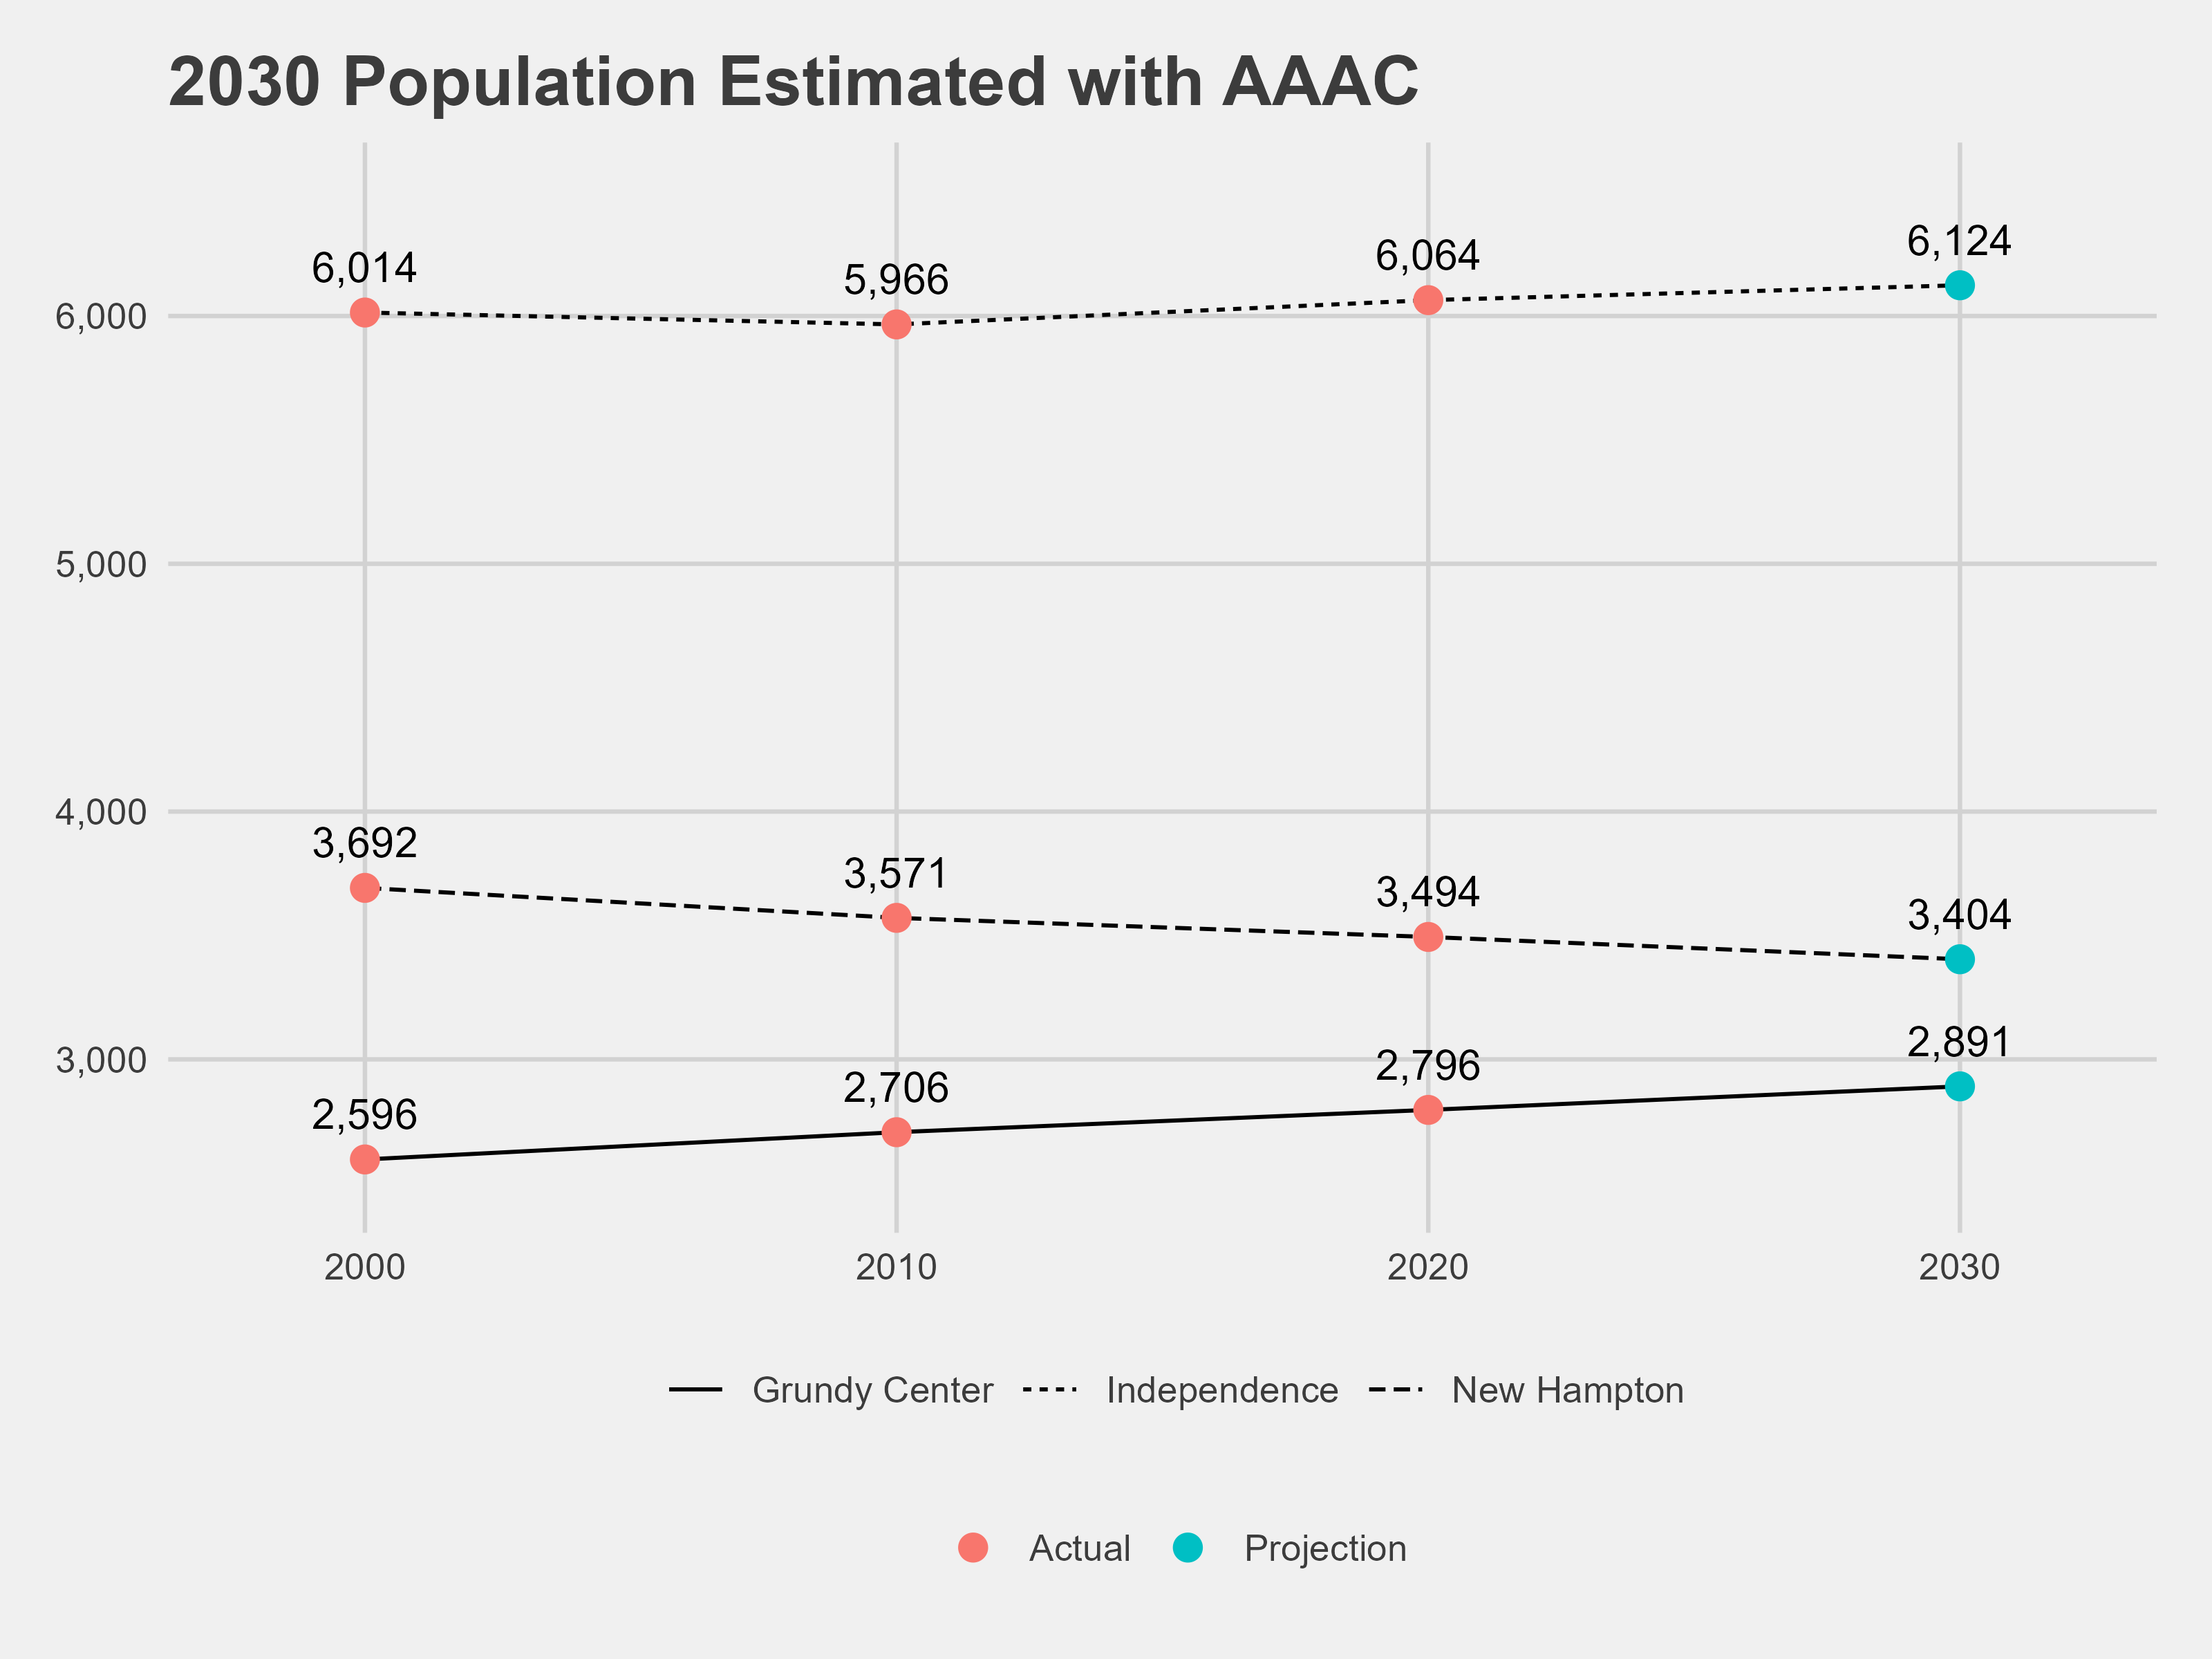
Finally, I calculated a population projection for 2030 using the AAAC method. AAAC stands for average annual absolute change.
AAAC = (population 1 - population 2) / time
Population projection = population + (time * AAAC)
Thursday
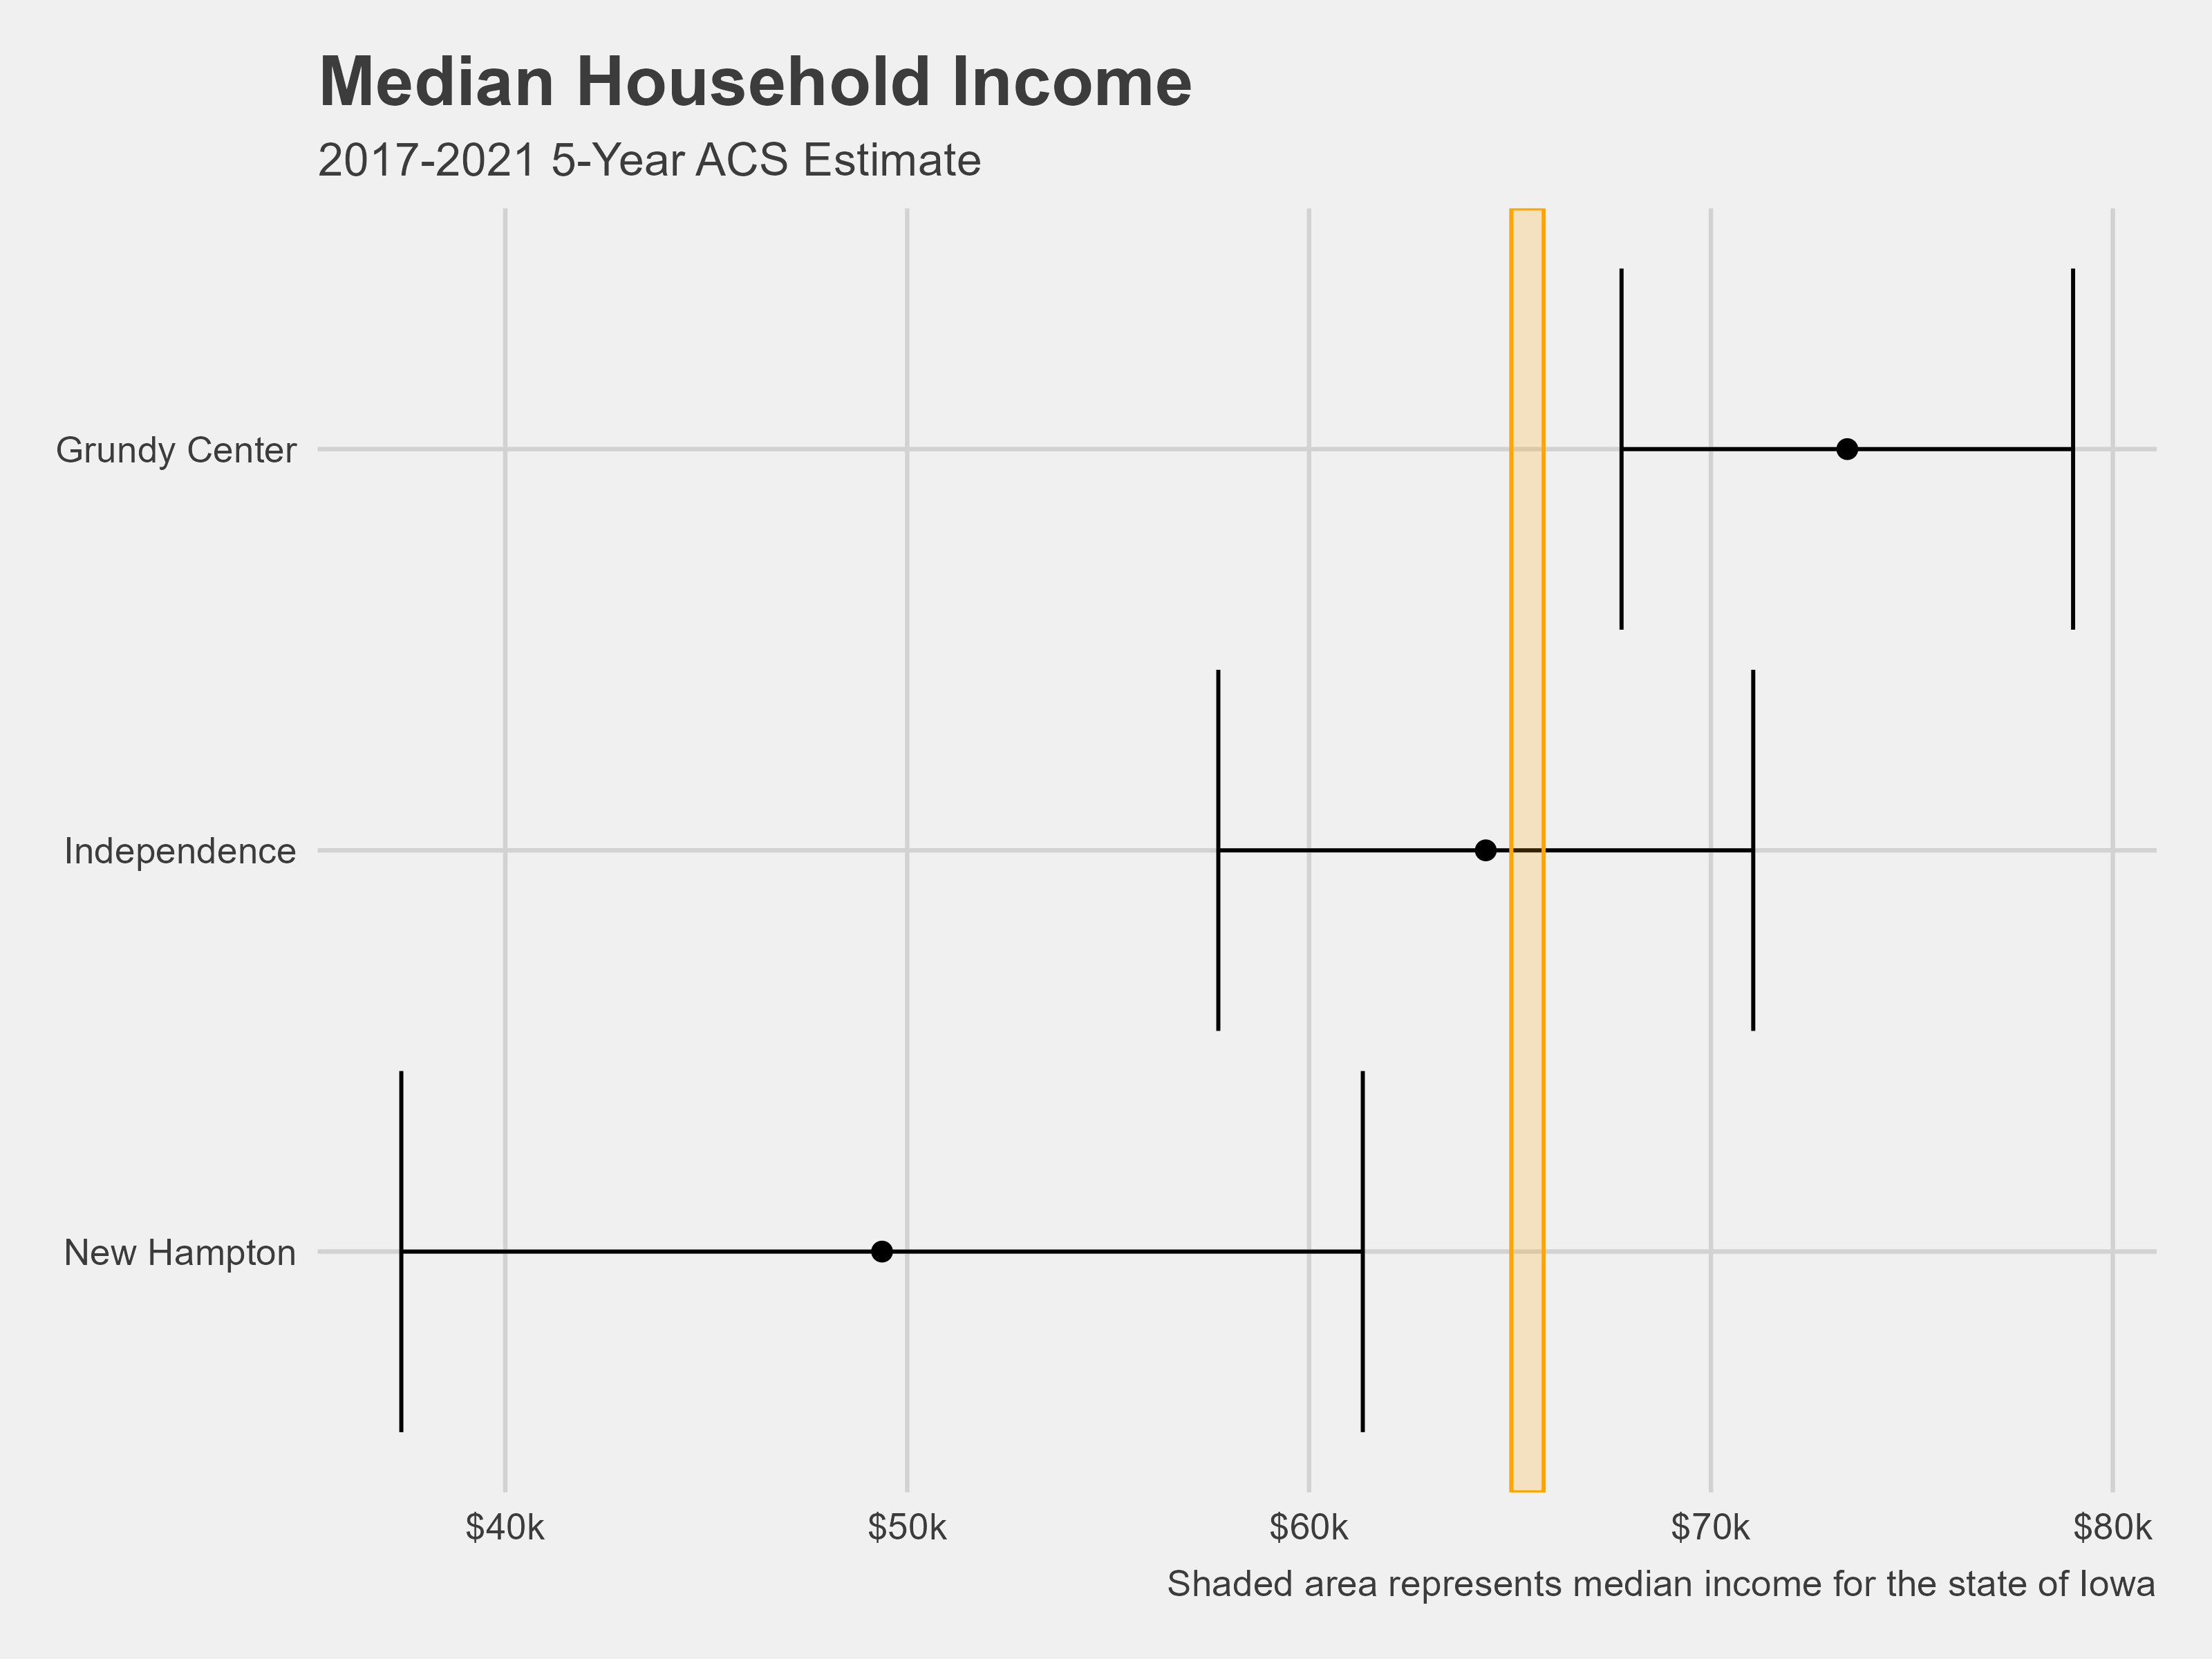
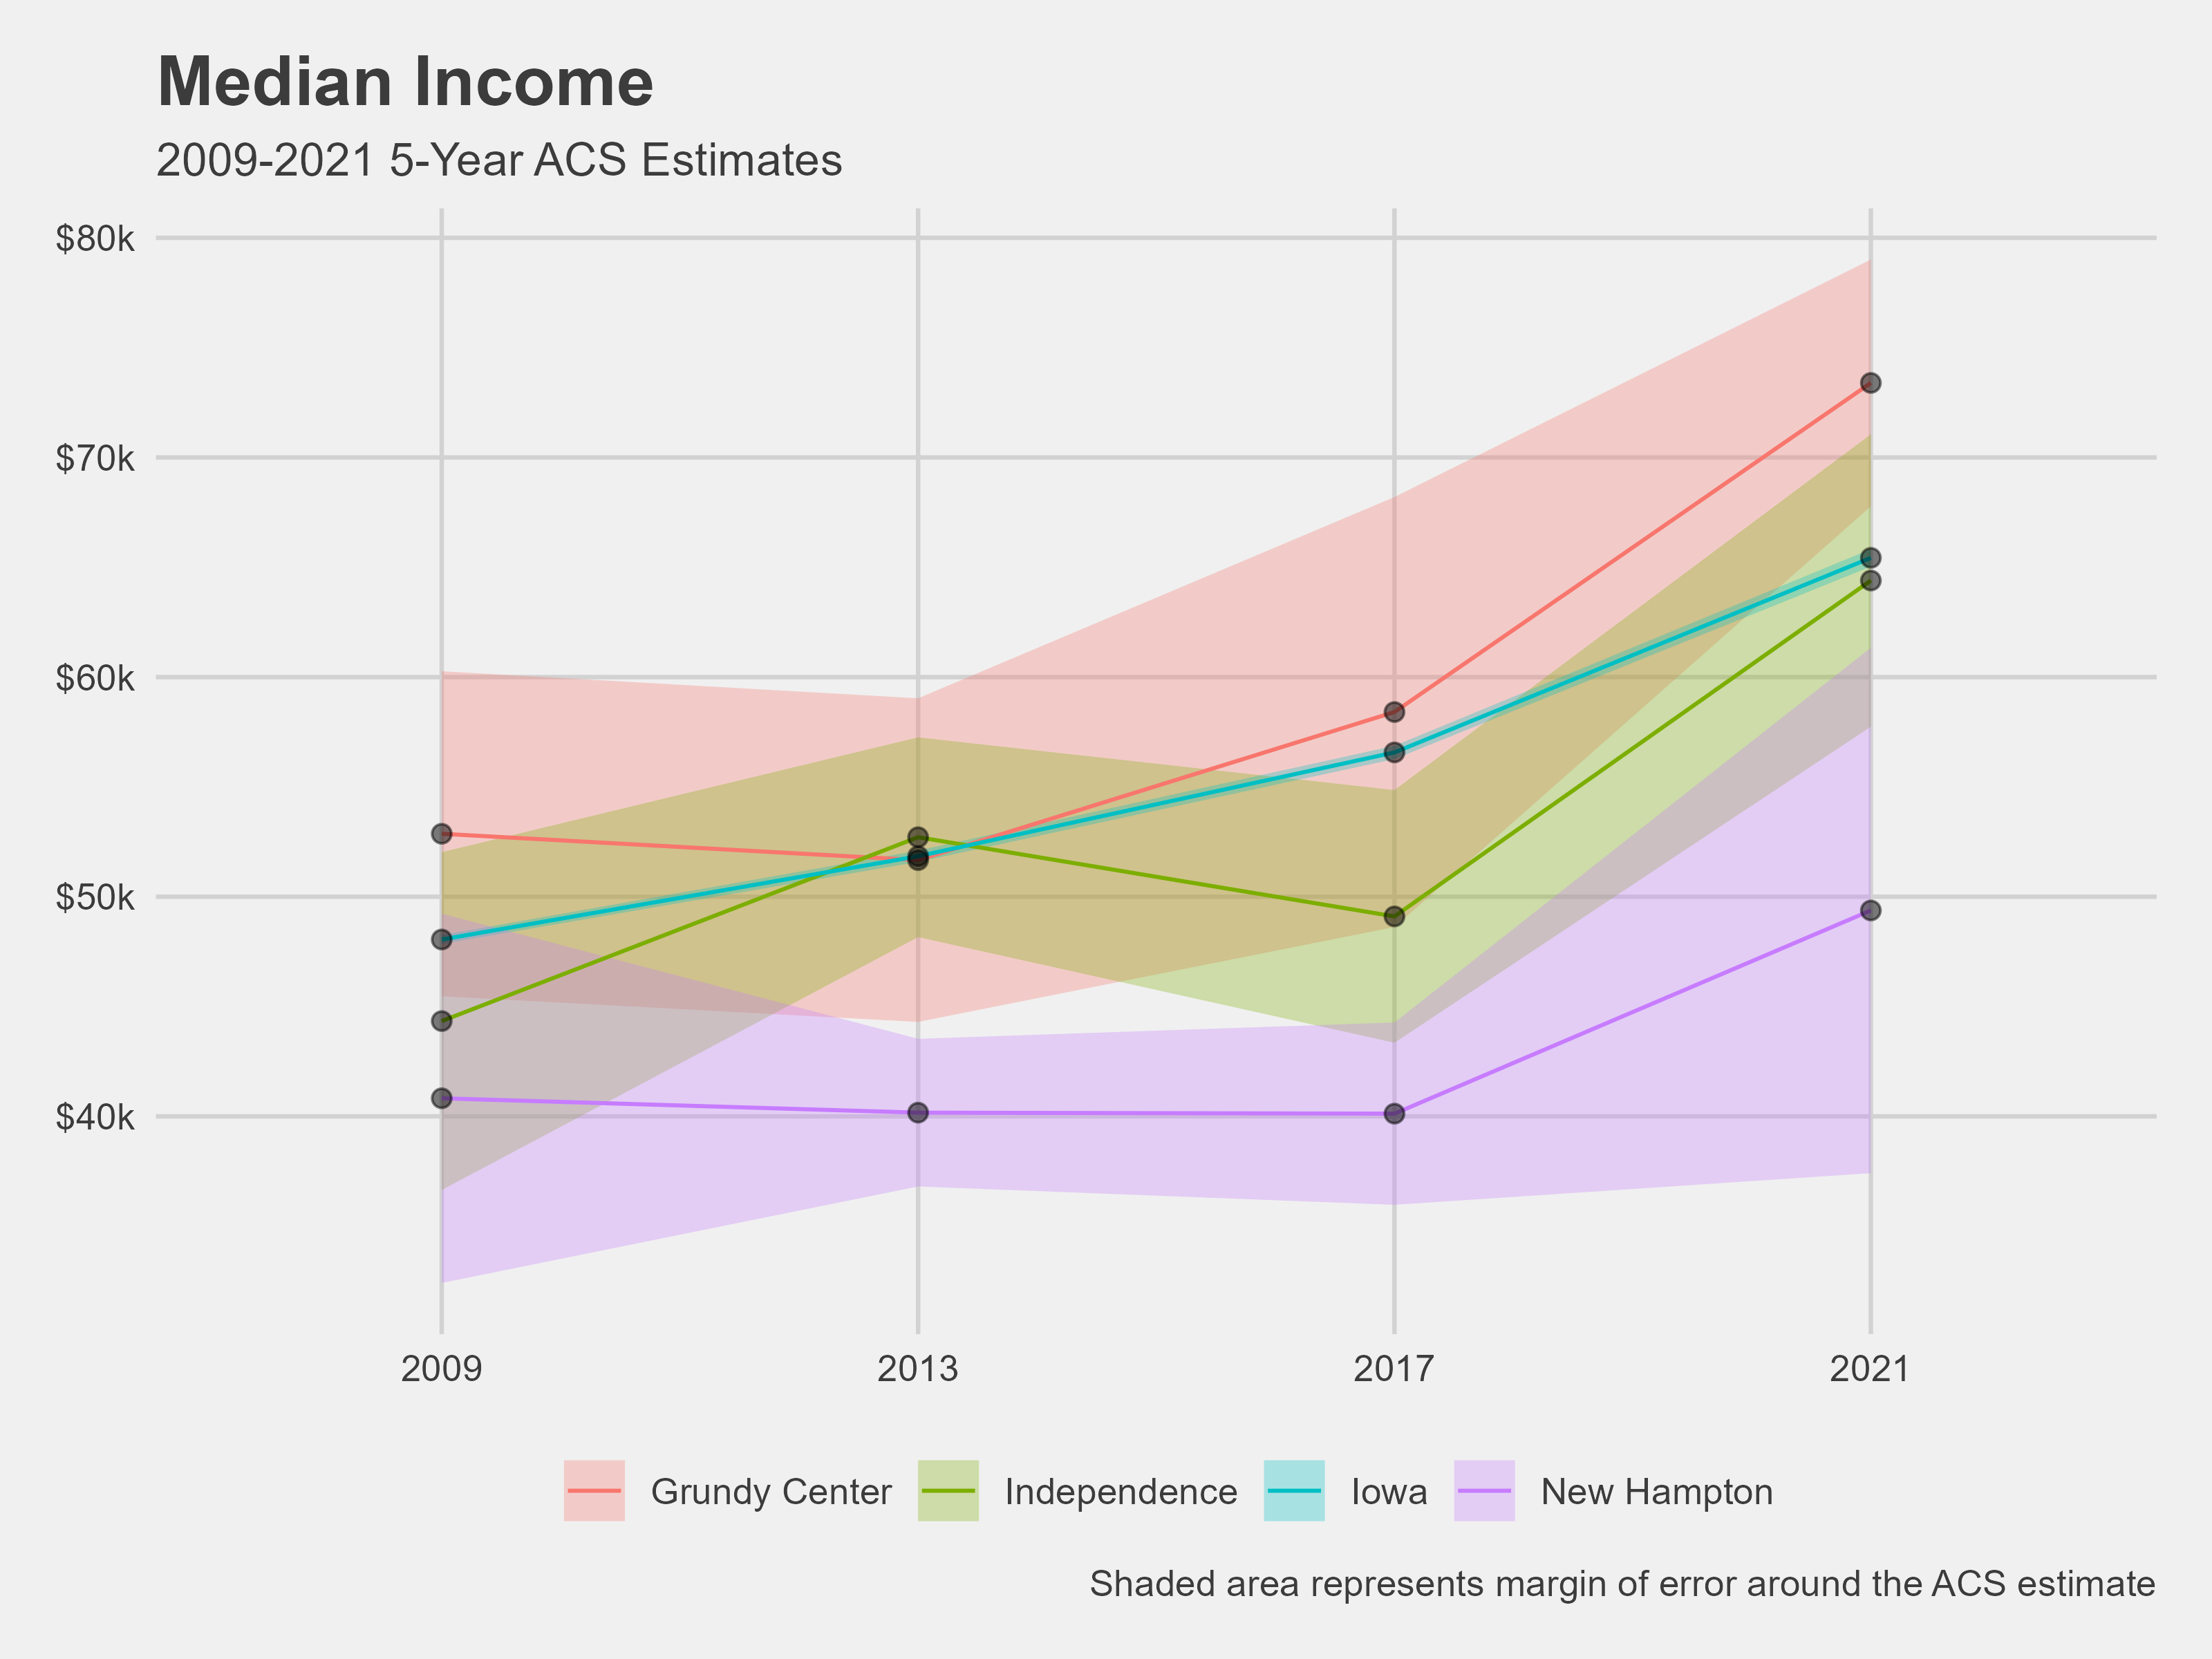
On Thursday, I finished the plots for income and housing value.
I spent some time Thursday afternoon searching the US Census website for API codes.
Link to 2021 5-Year ACS API codes: https://api.census.gov/data/2021/acs/acs5/variables.html
Year Structure Built variables
| Variable Name | API Code |
|---|---|
| Total | B25034_001 |
| 2020 or later | B25034_002 |
| 2010-2019 | B25034_003 |
| 2000-2009 | B25034_004 |
| 1990-1999 | B25034_005 |
| 1980-1989 | B25034_006 |
| 1970-1979 | B25034_007 |
| 1960-1969 | B25034_008 |
| 1950-1959 | B25034_009 |
| 1940-1949 | B25034_010 |
| 1939 or earlier | B25034_011 |
| Median structure age | B25035_001 |
Number of Bedrooms = B25041_001 through B25041_007
Median House Value by Year Structure Built = B25107_001 through B25107_011
Total Housing Units = B25002_001
Occupied Housing Units = B25002_002
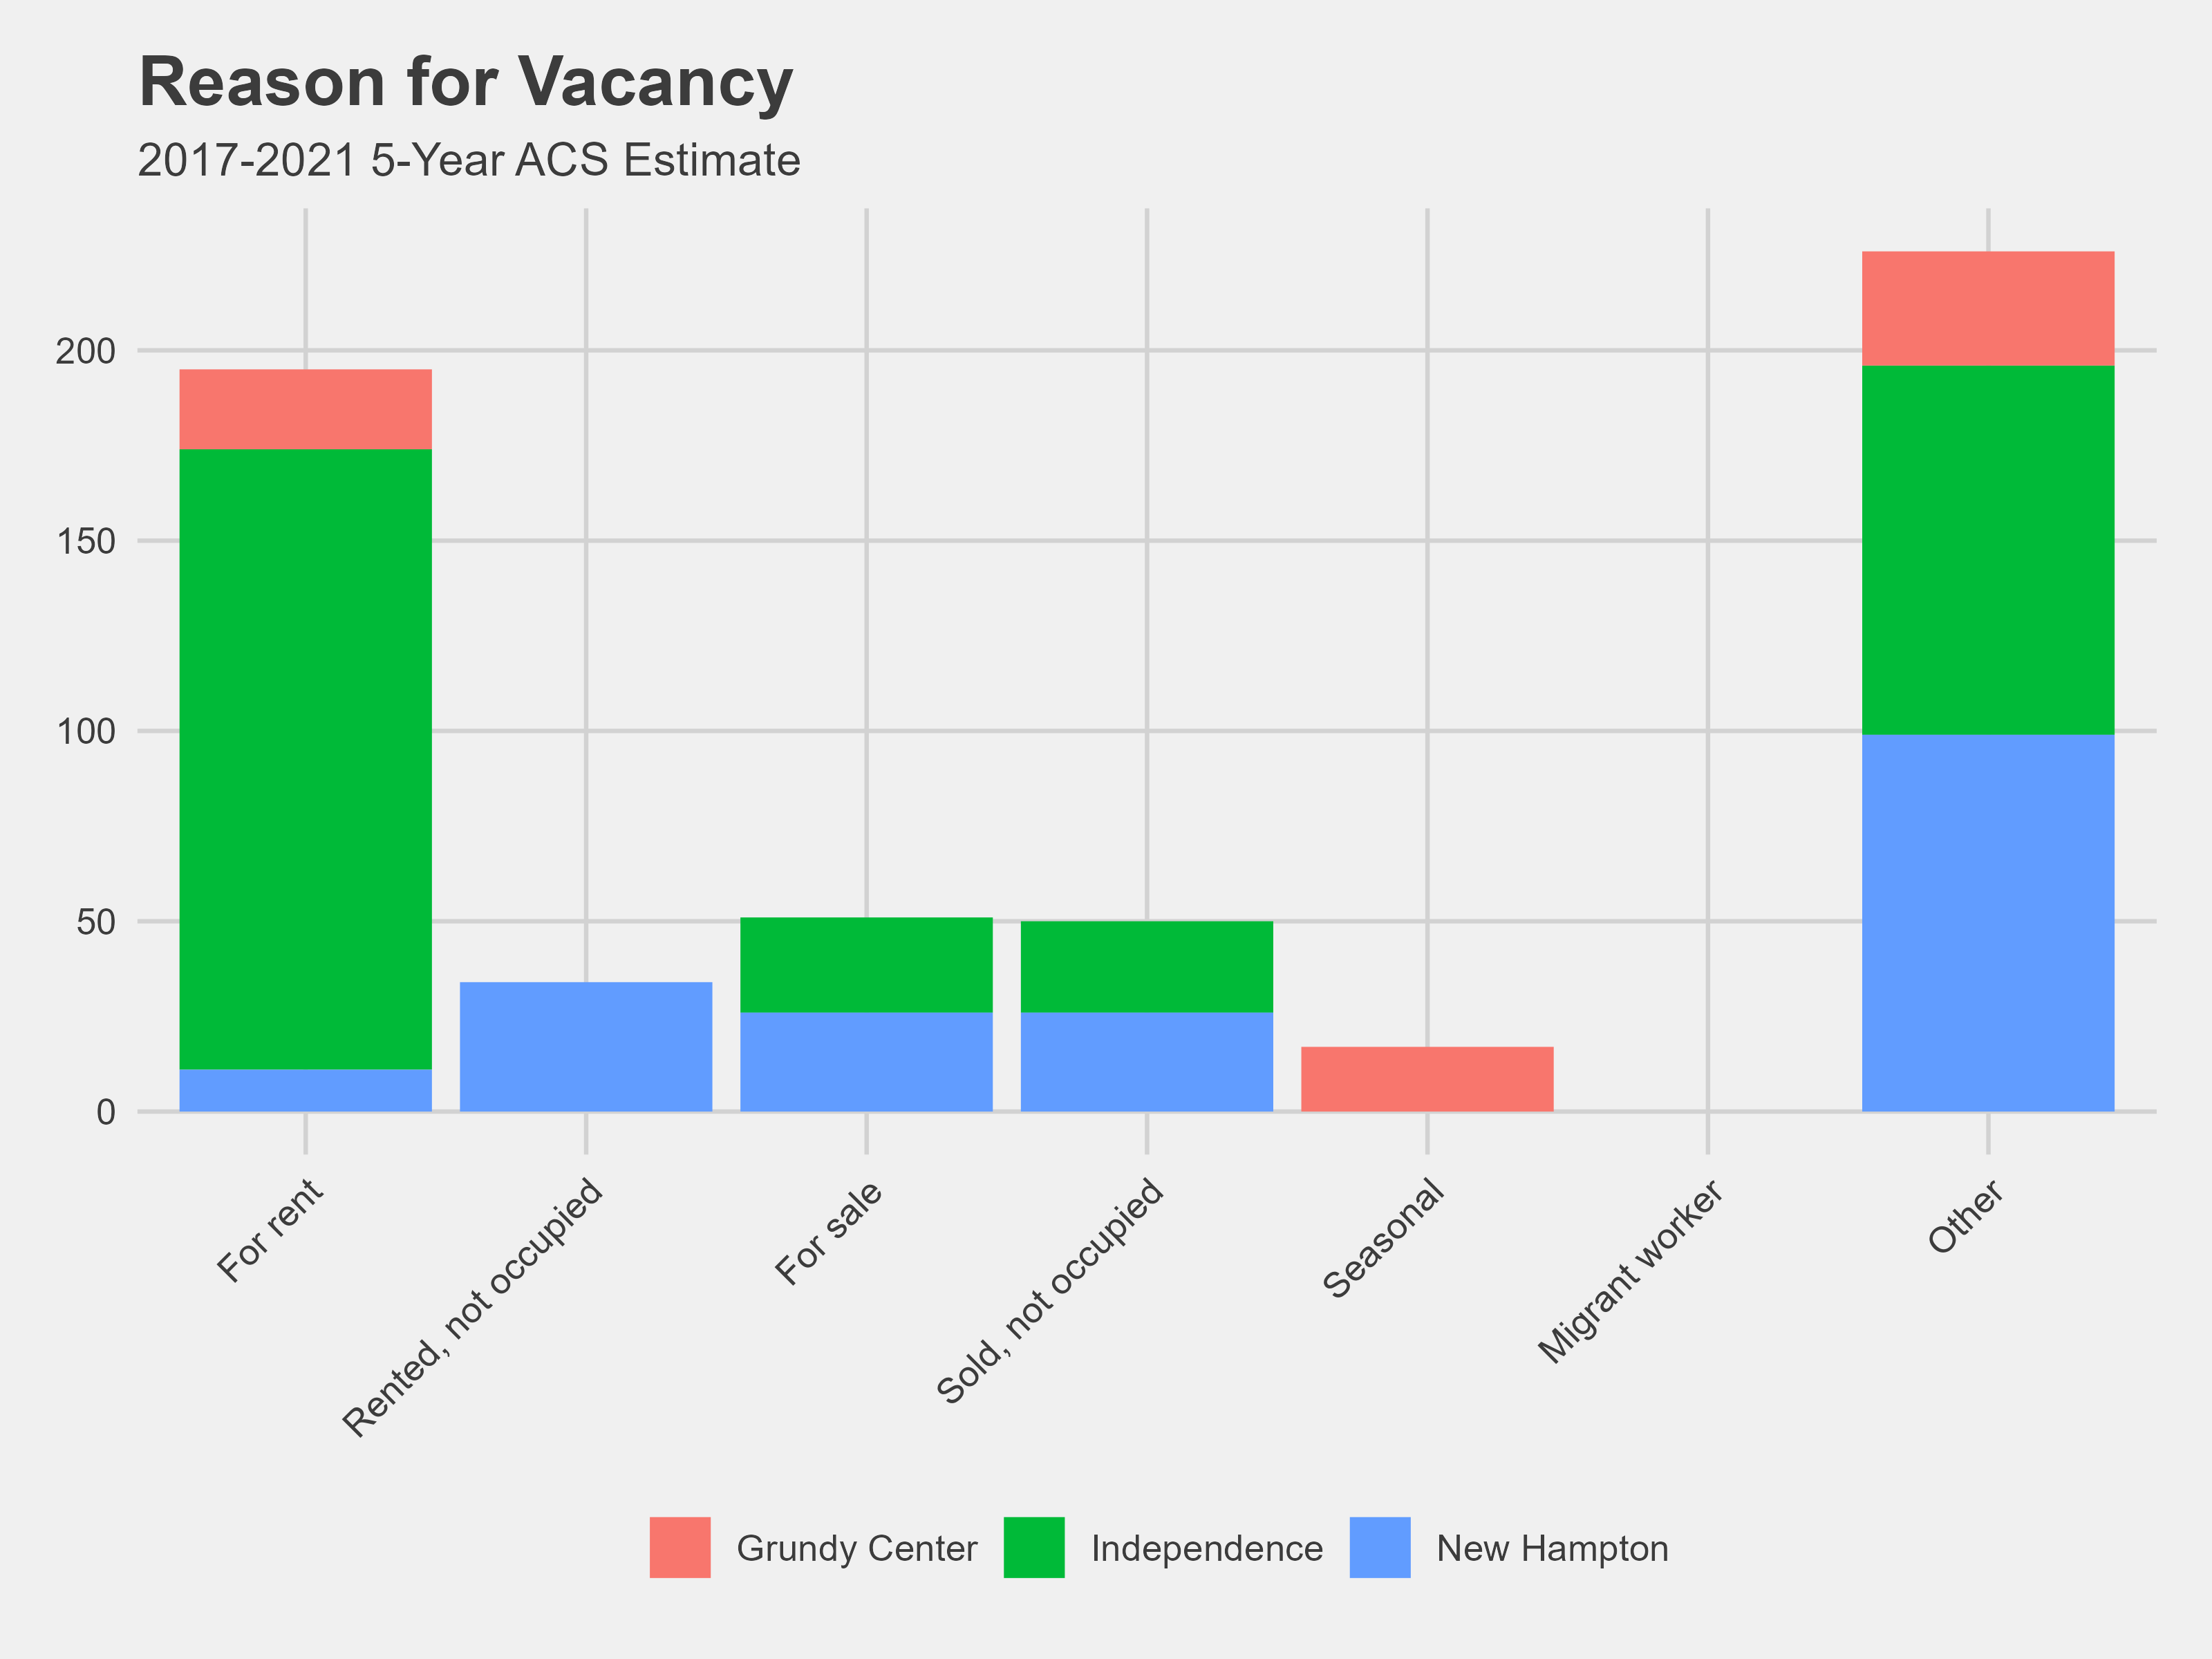
Vacant Housing Units = B25002_003
Vacancy Status
| Variable Name | API Code |
|---|---|
| For rent | B25004_002 |
| Rented, not occupied | B25004_003 |
| For sale | B25004_004 |
| Sold, not occupied | B25004_005 |
| Seasonal | B25004_006 |
| Migrant workers | B25004_007 |
| Other | B25004_008 |
Friday
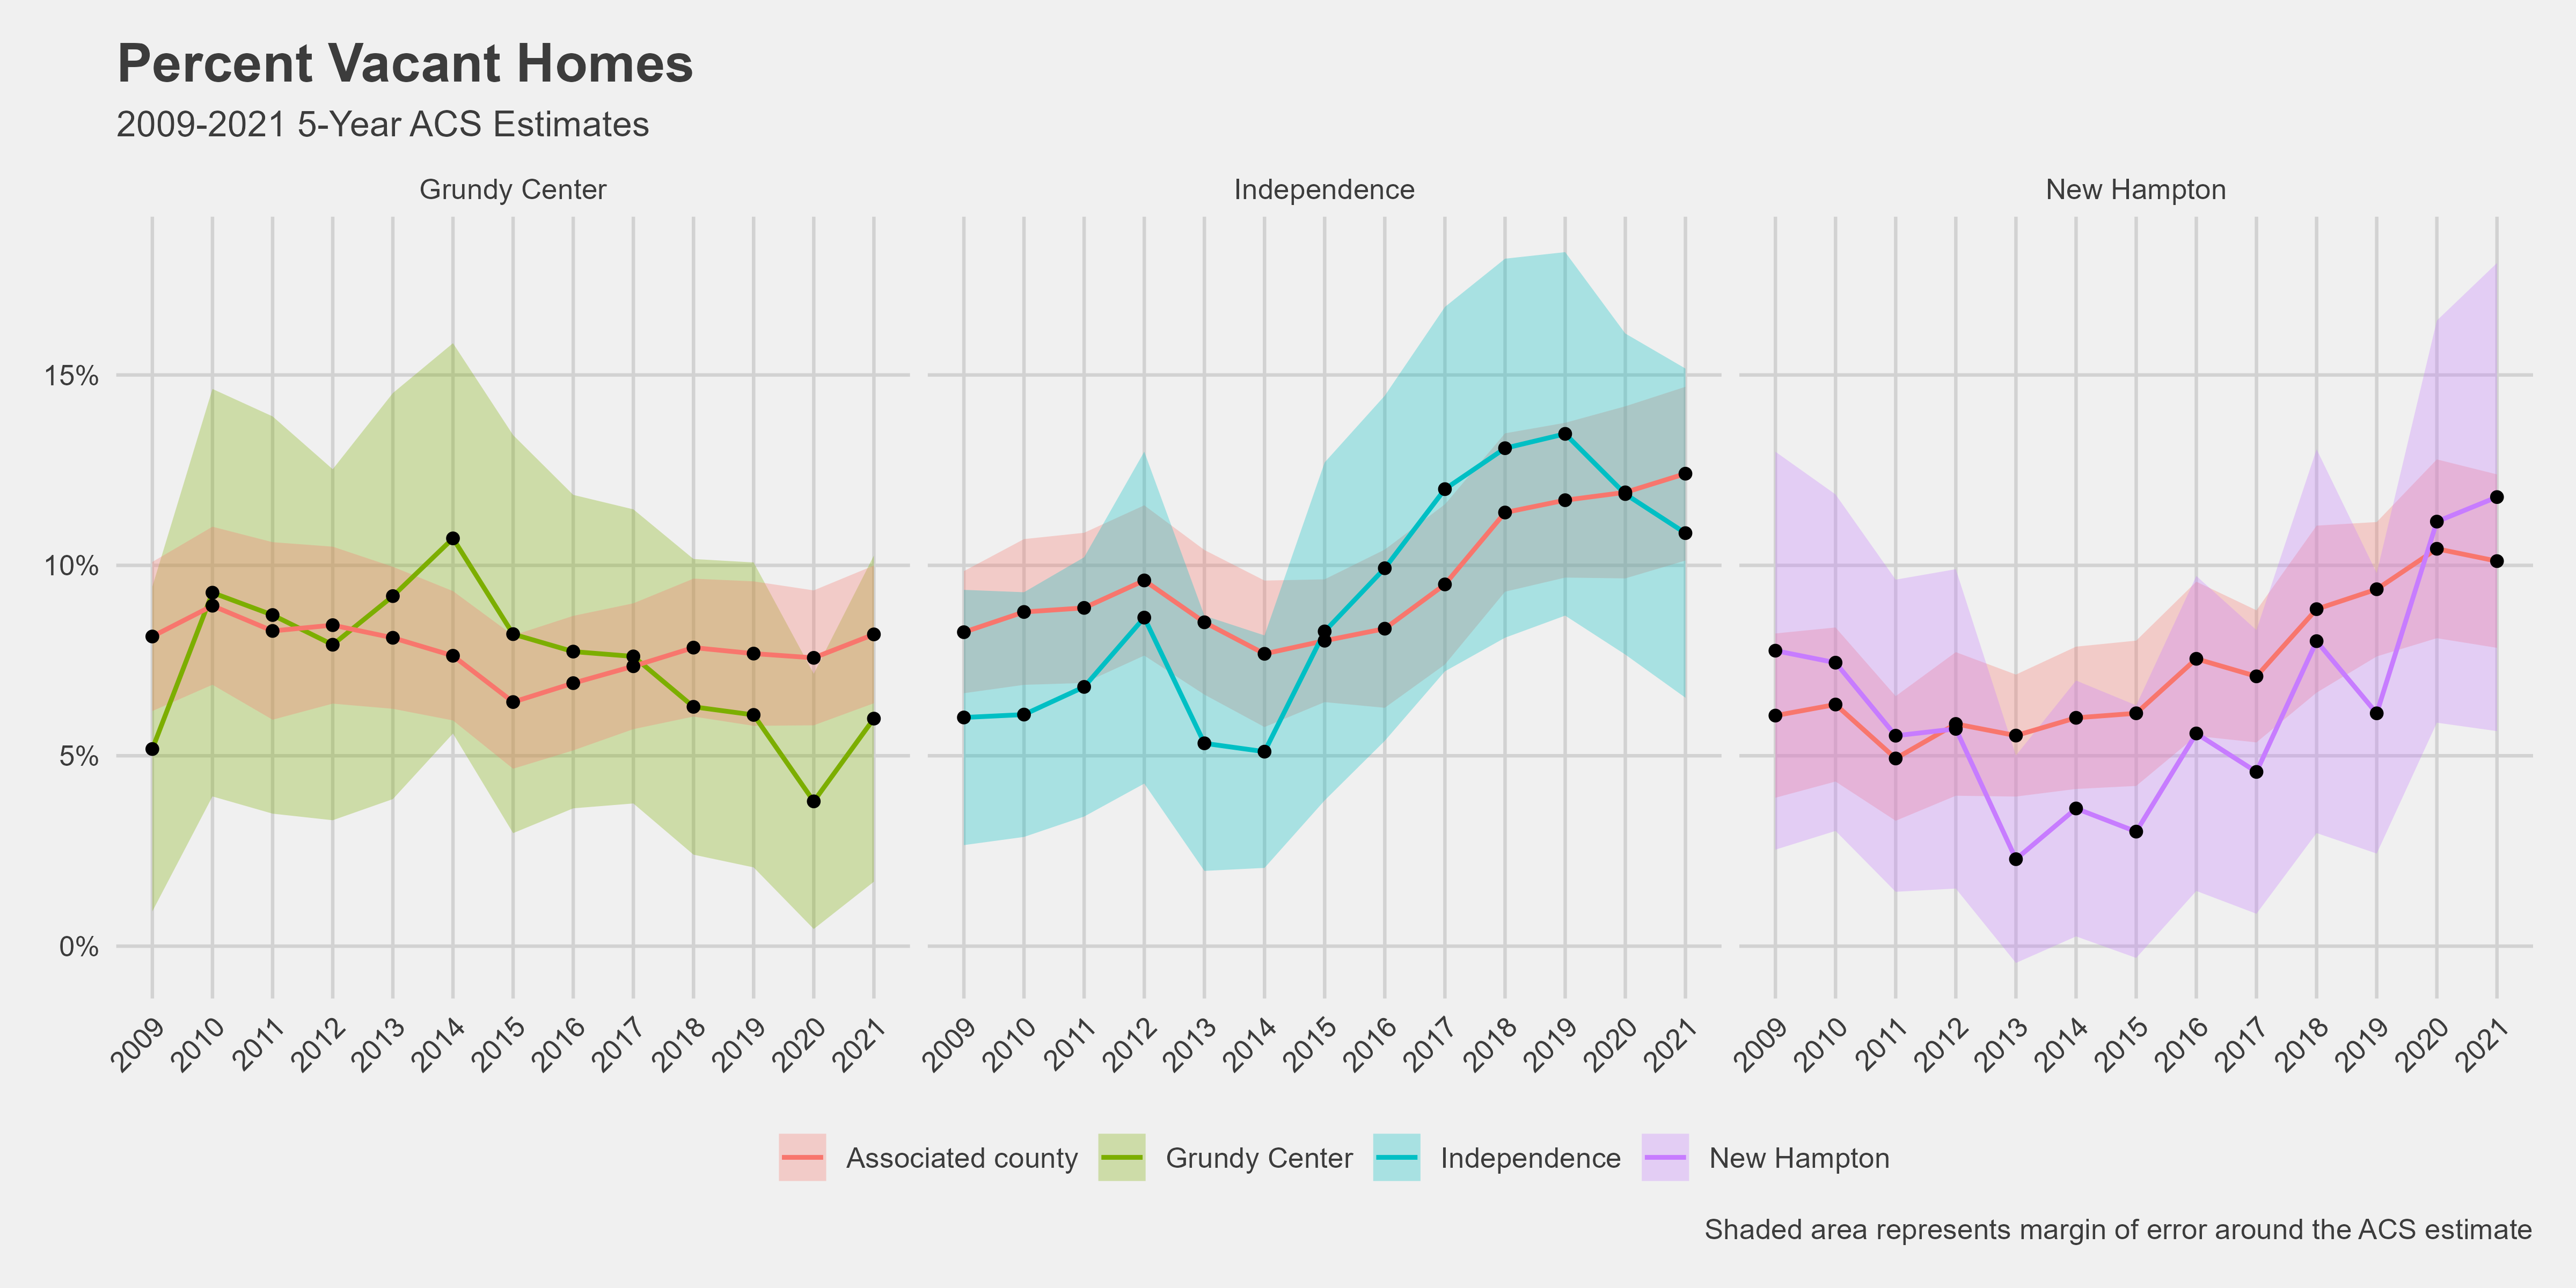
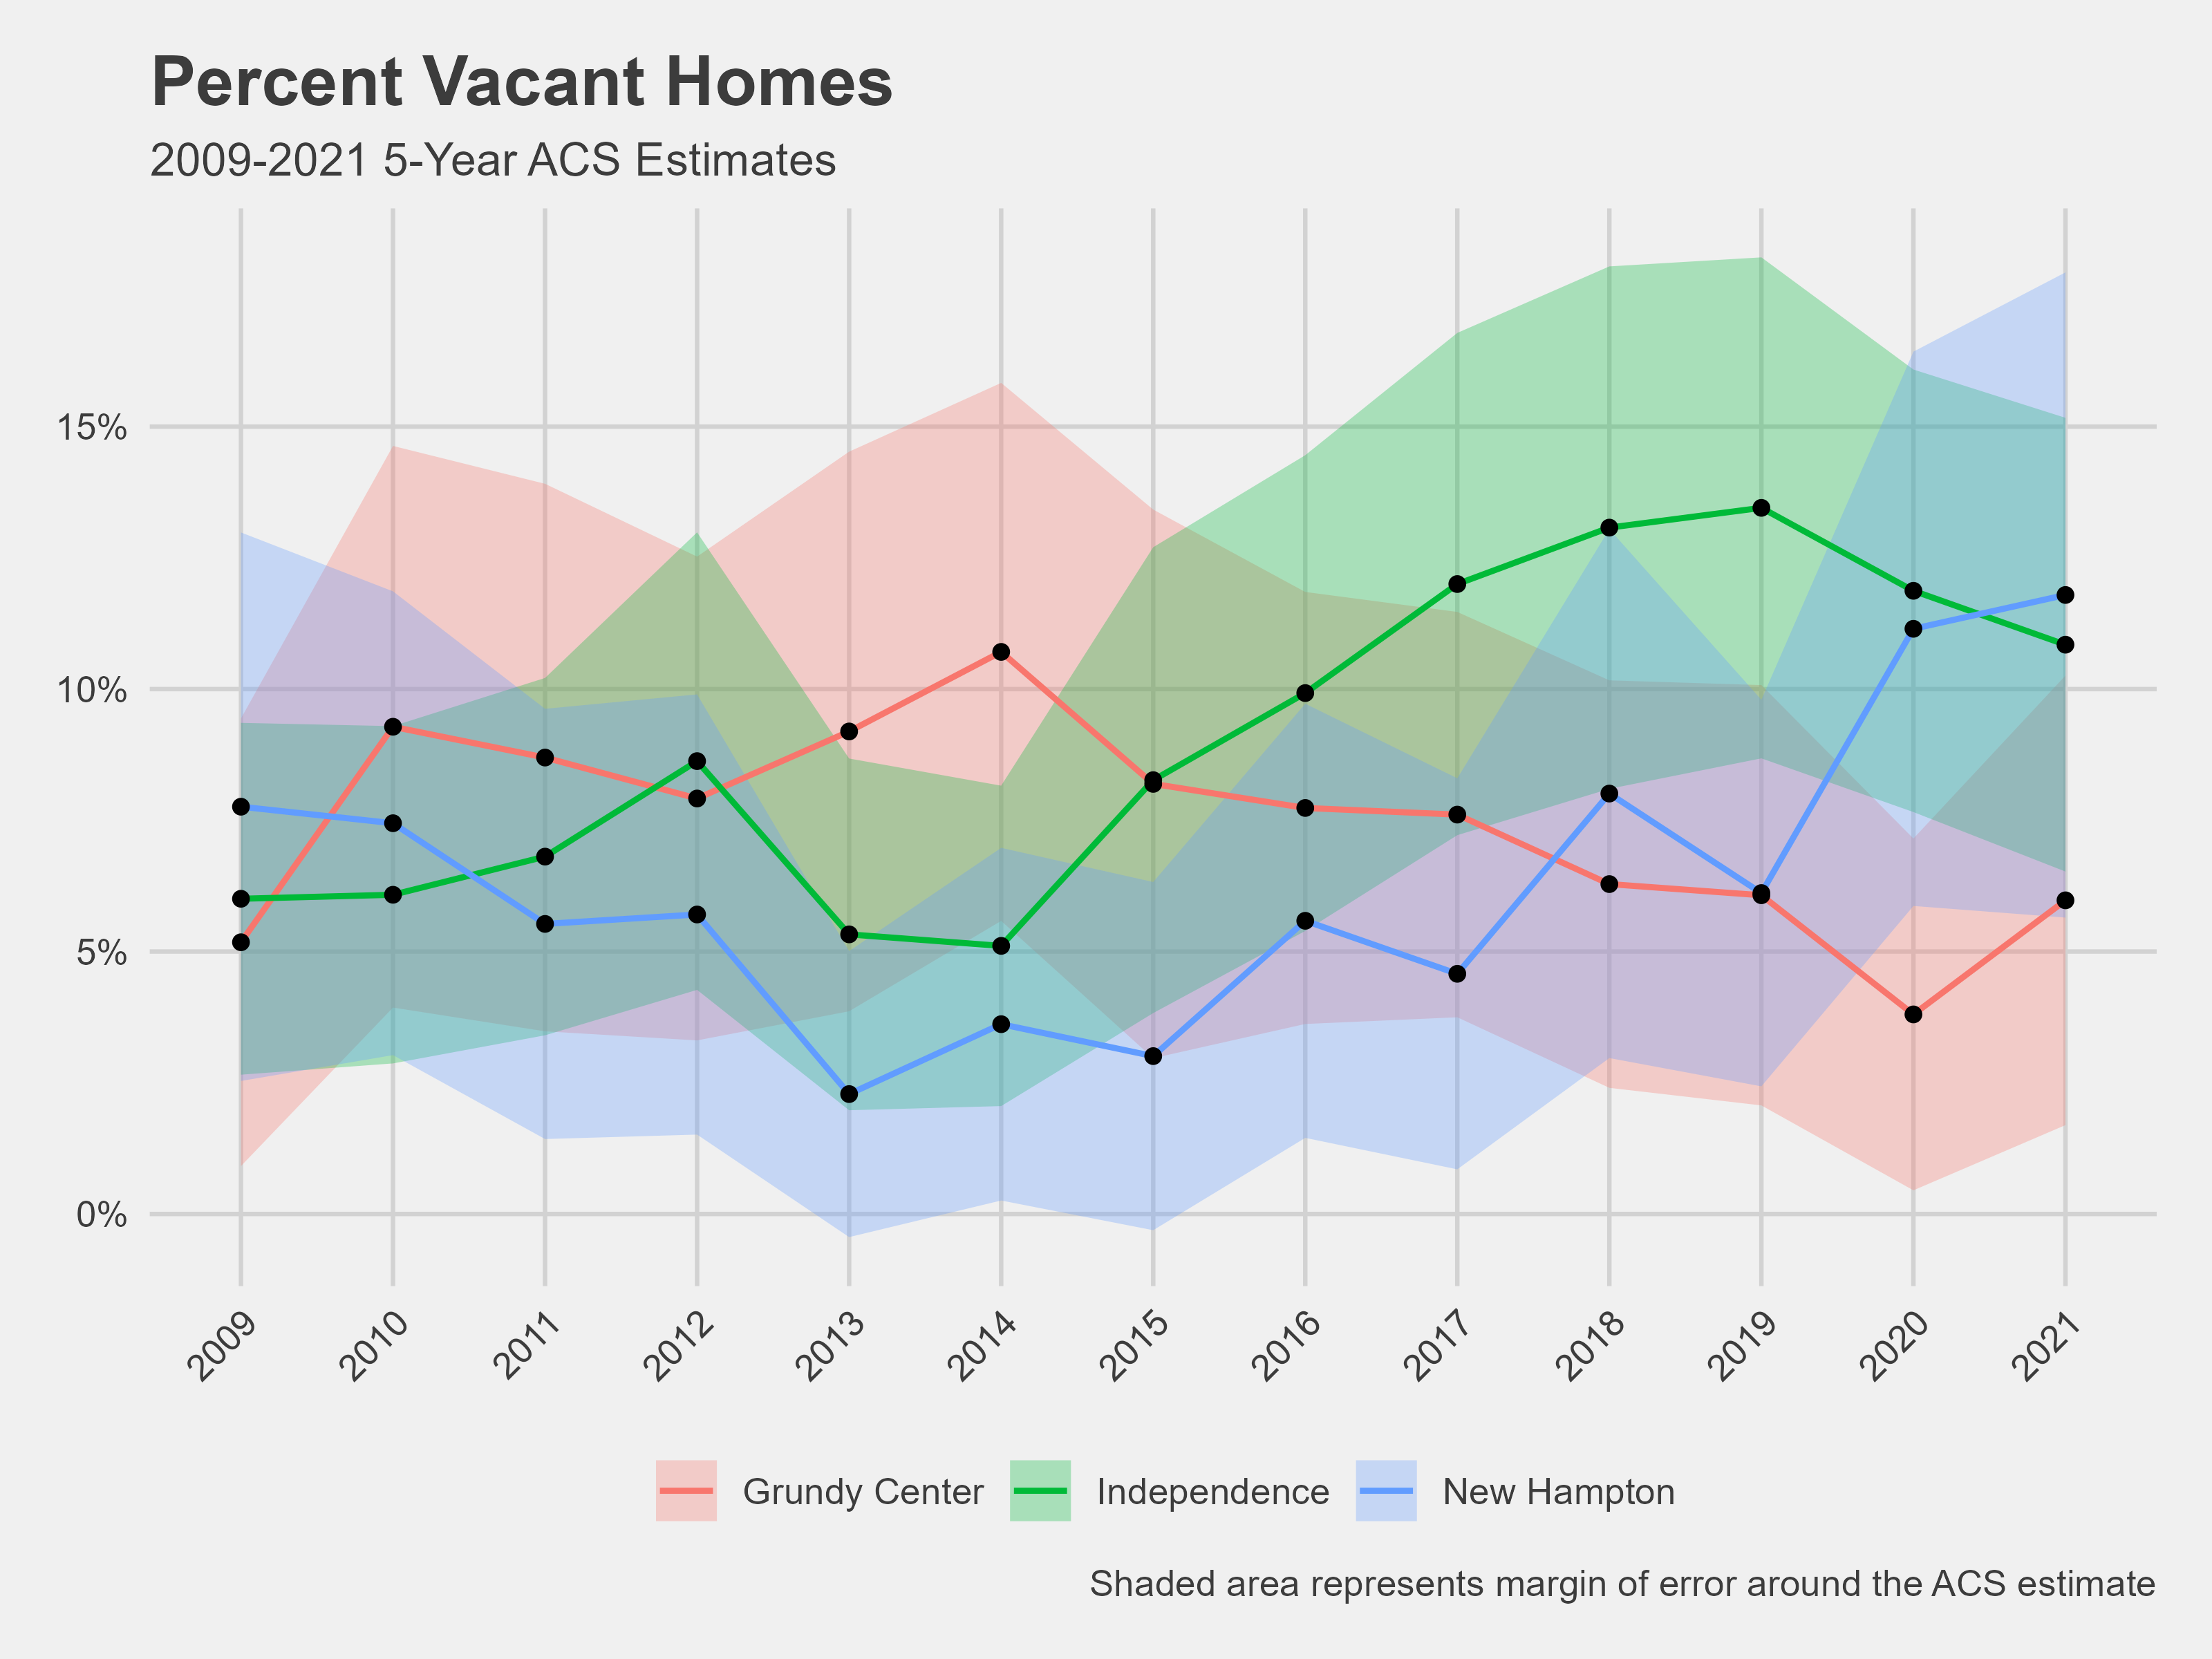
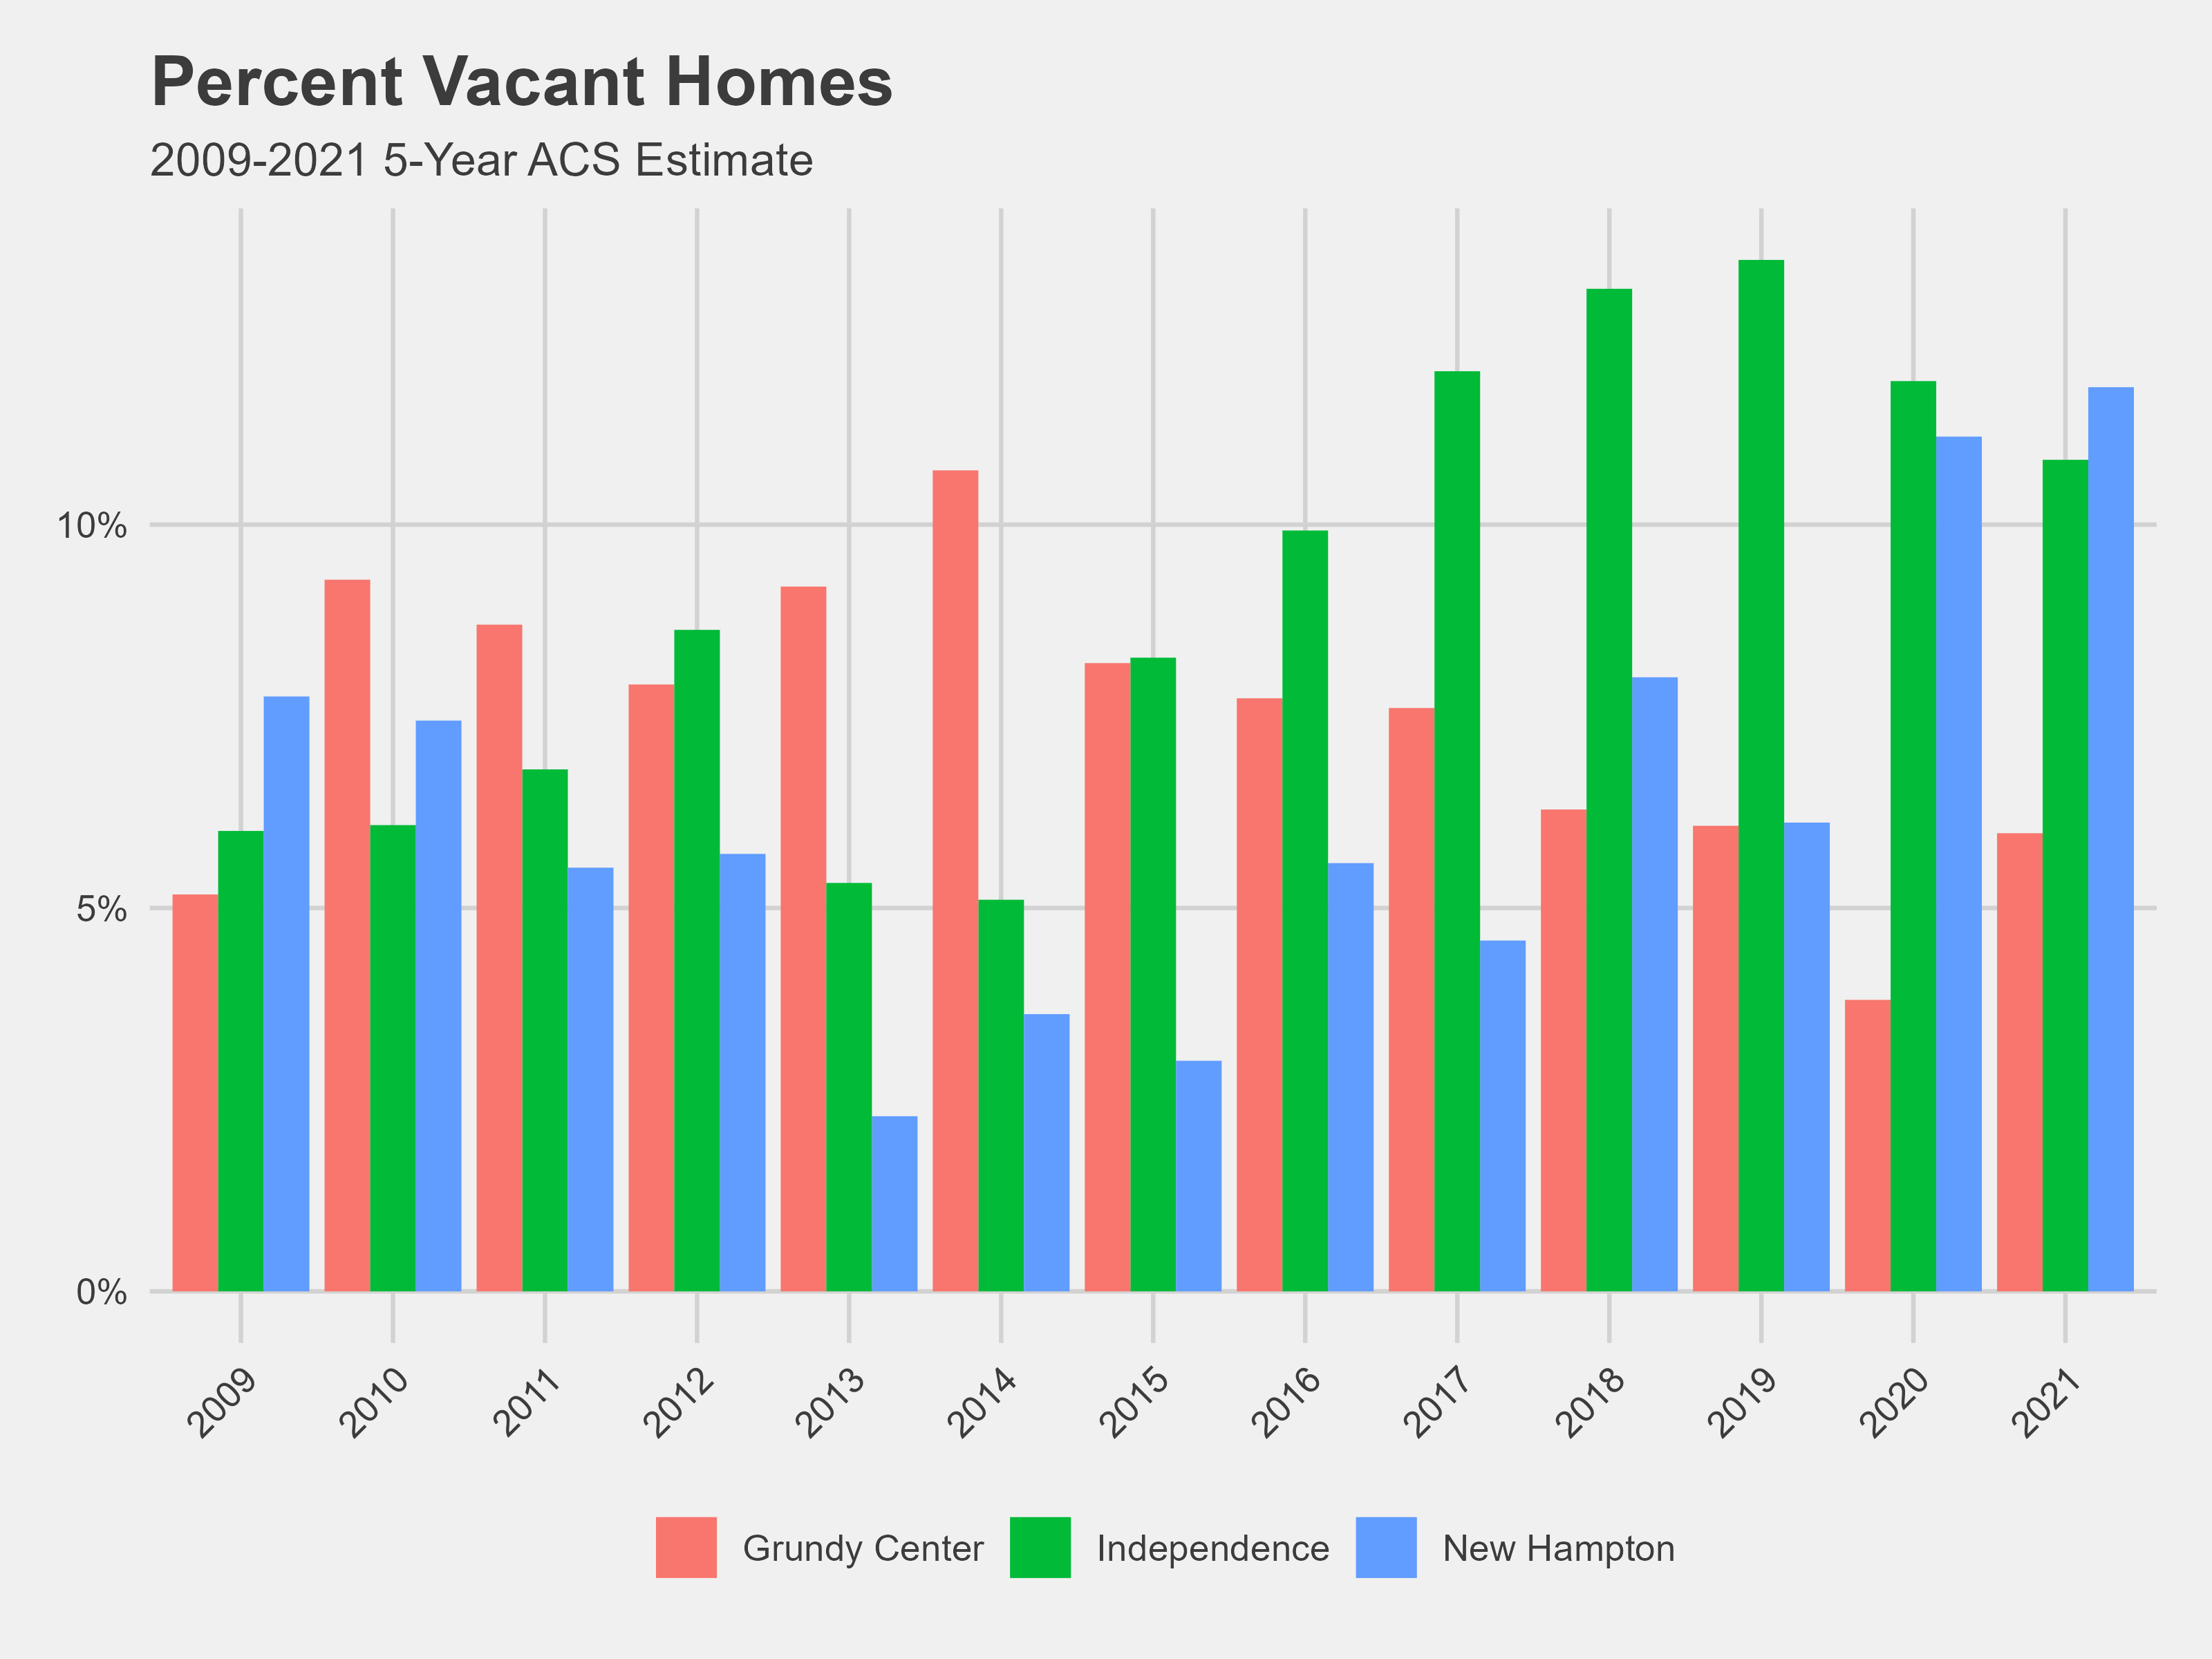
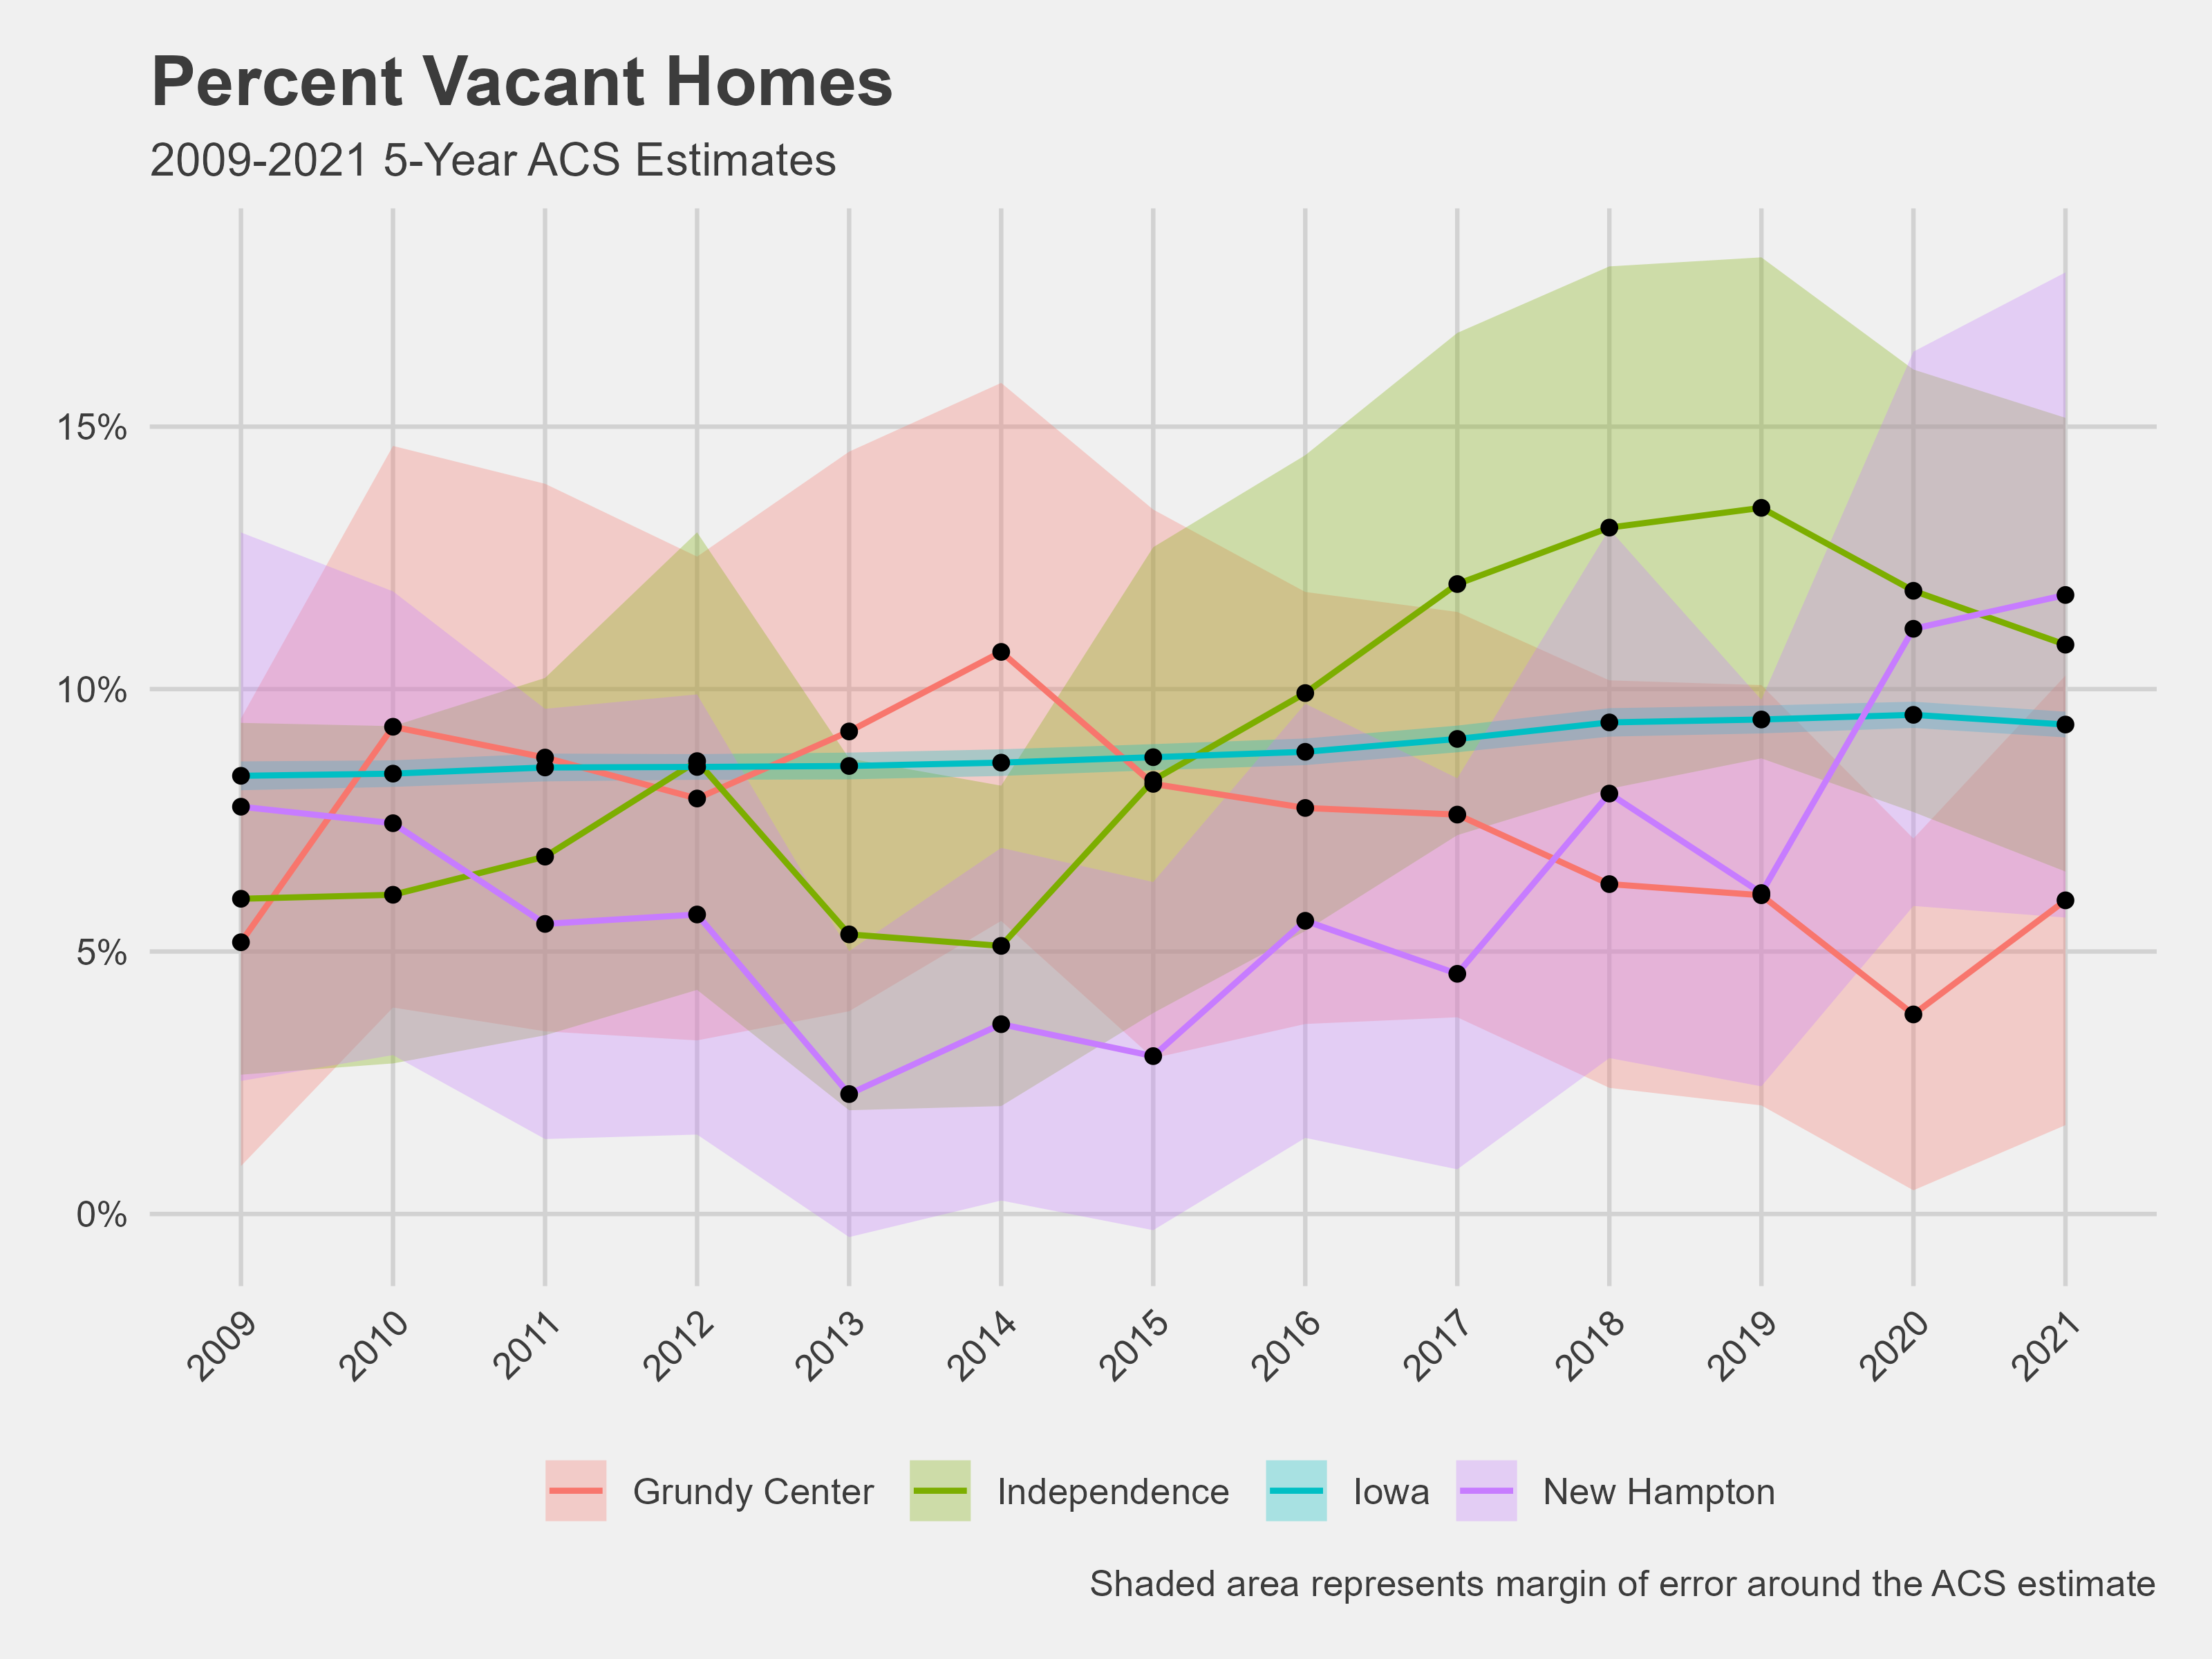
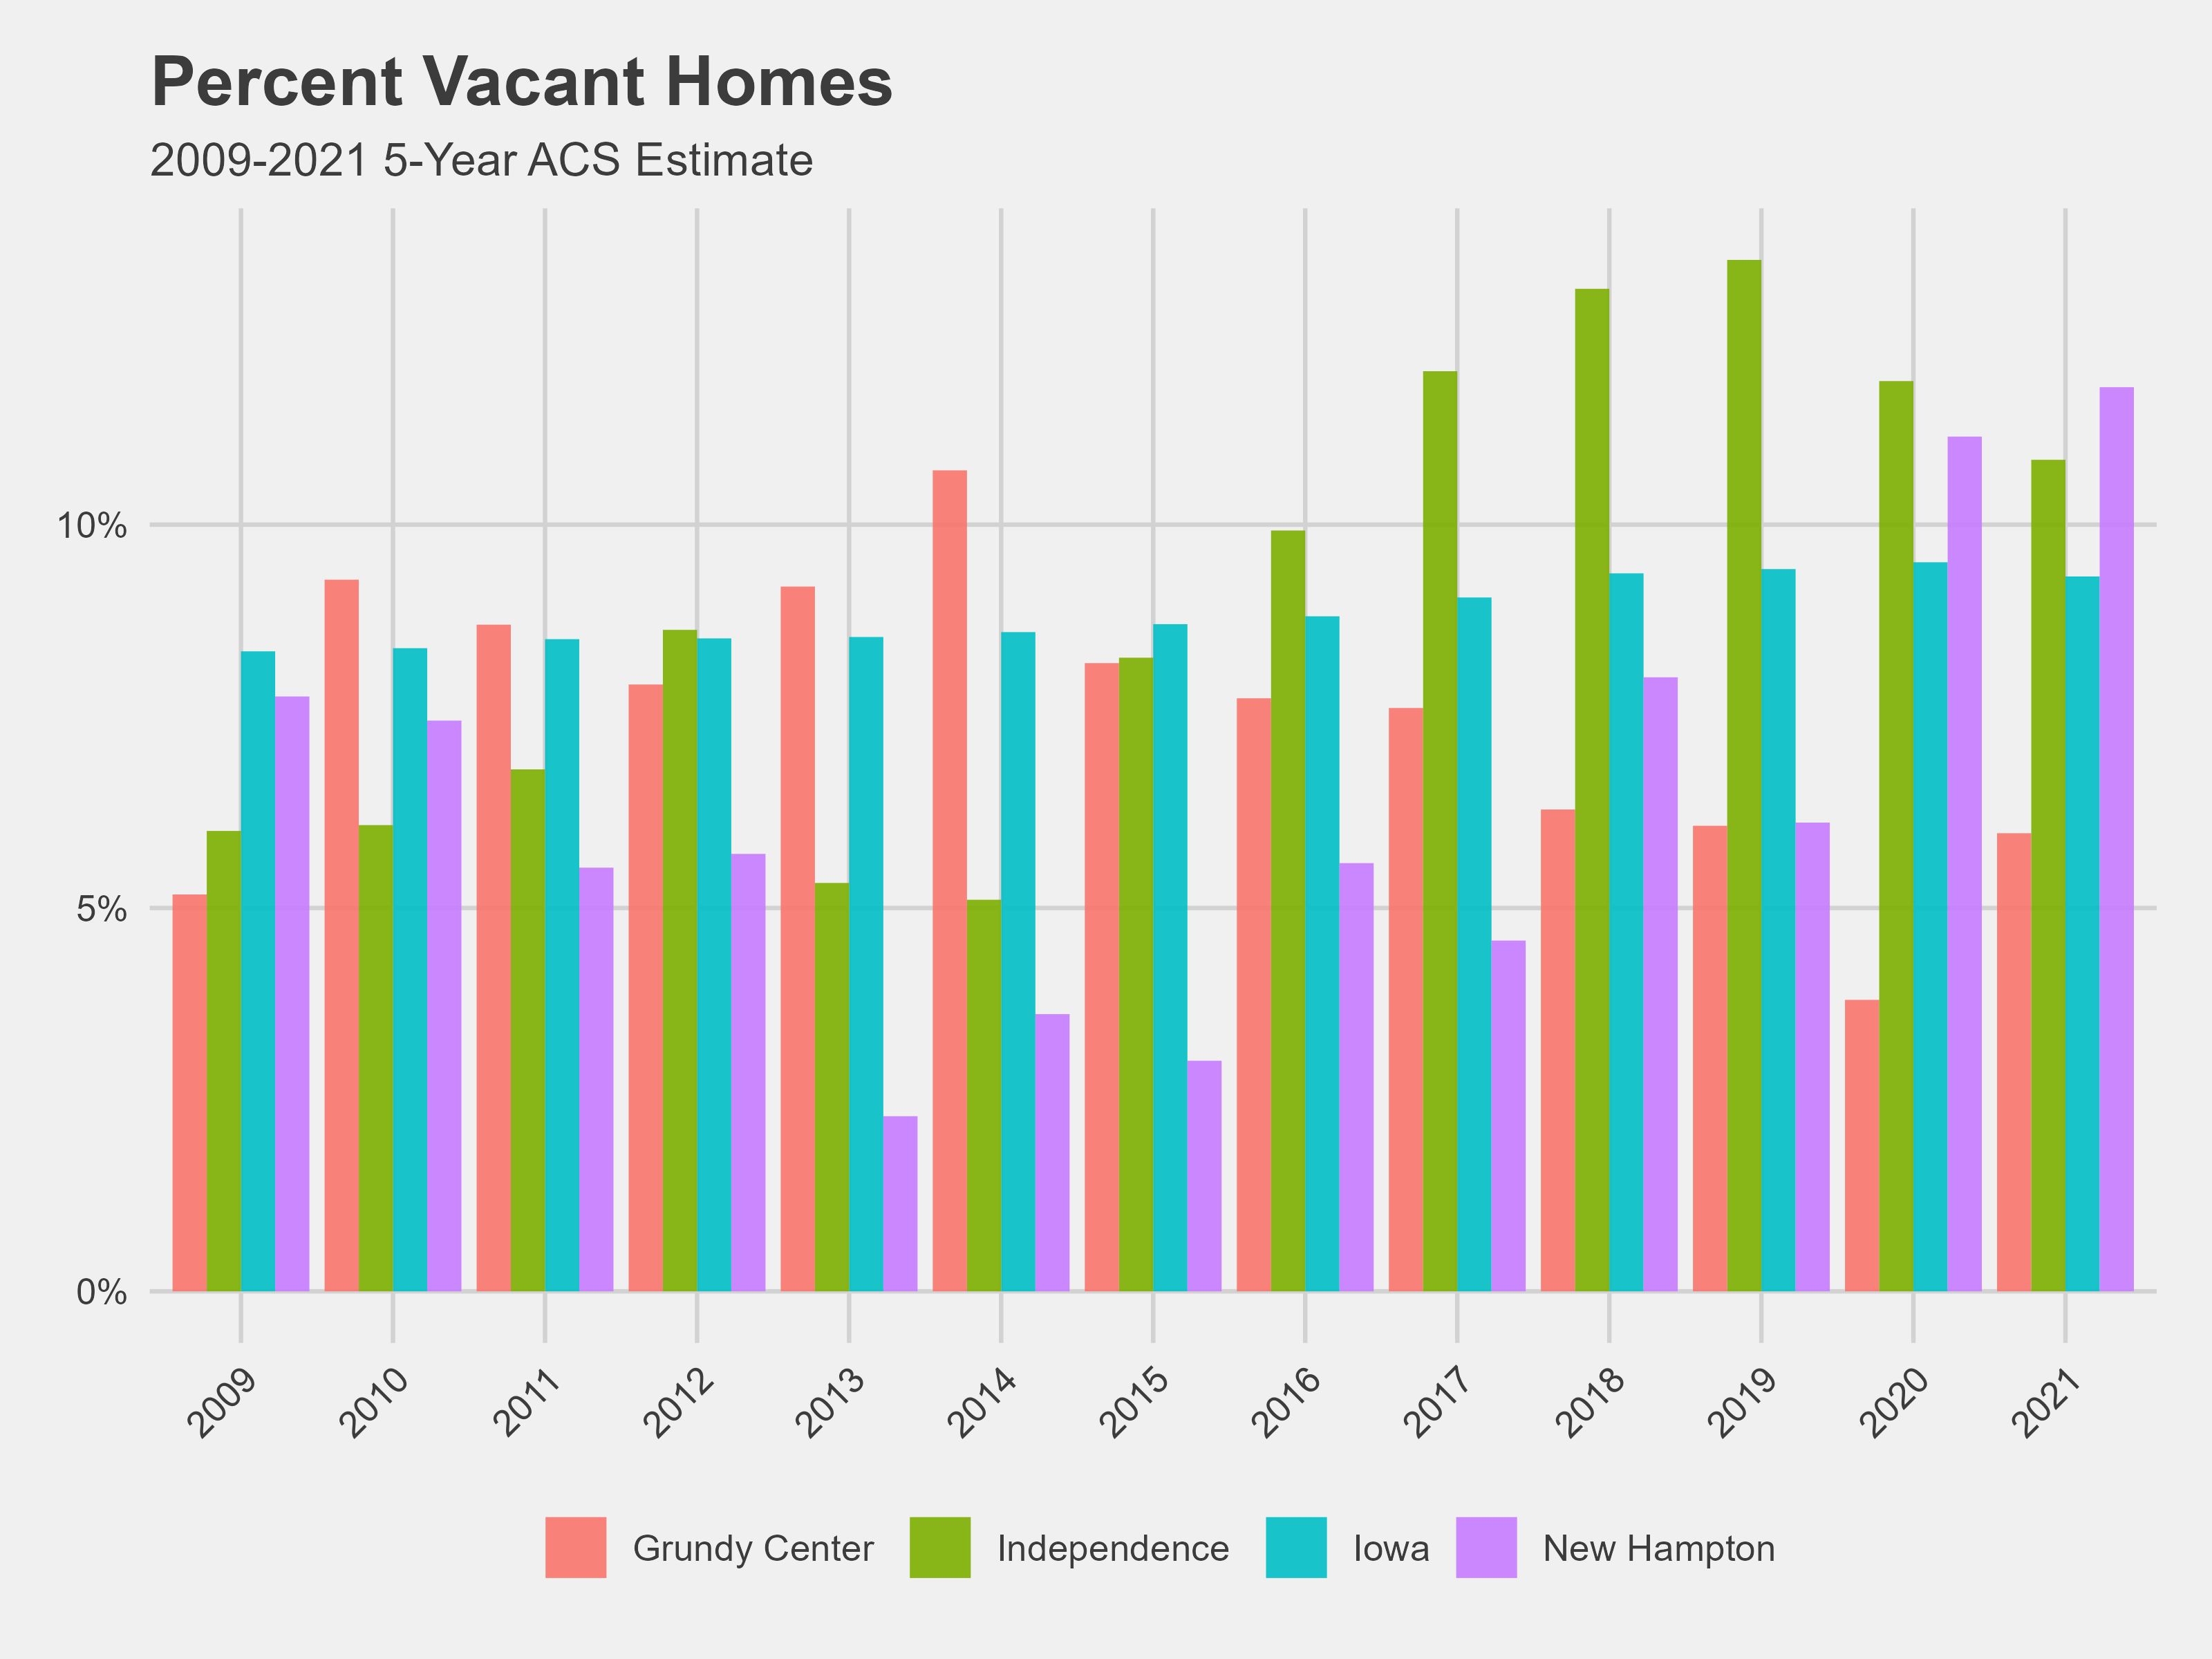
On Friday, I finished the rest of the plots for the demographic profile.
** insert year built plots **
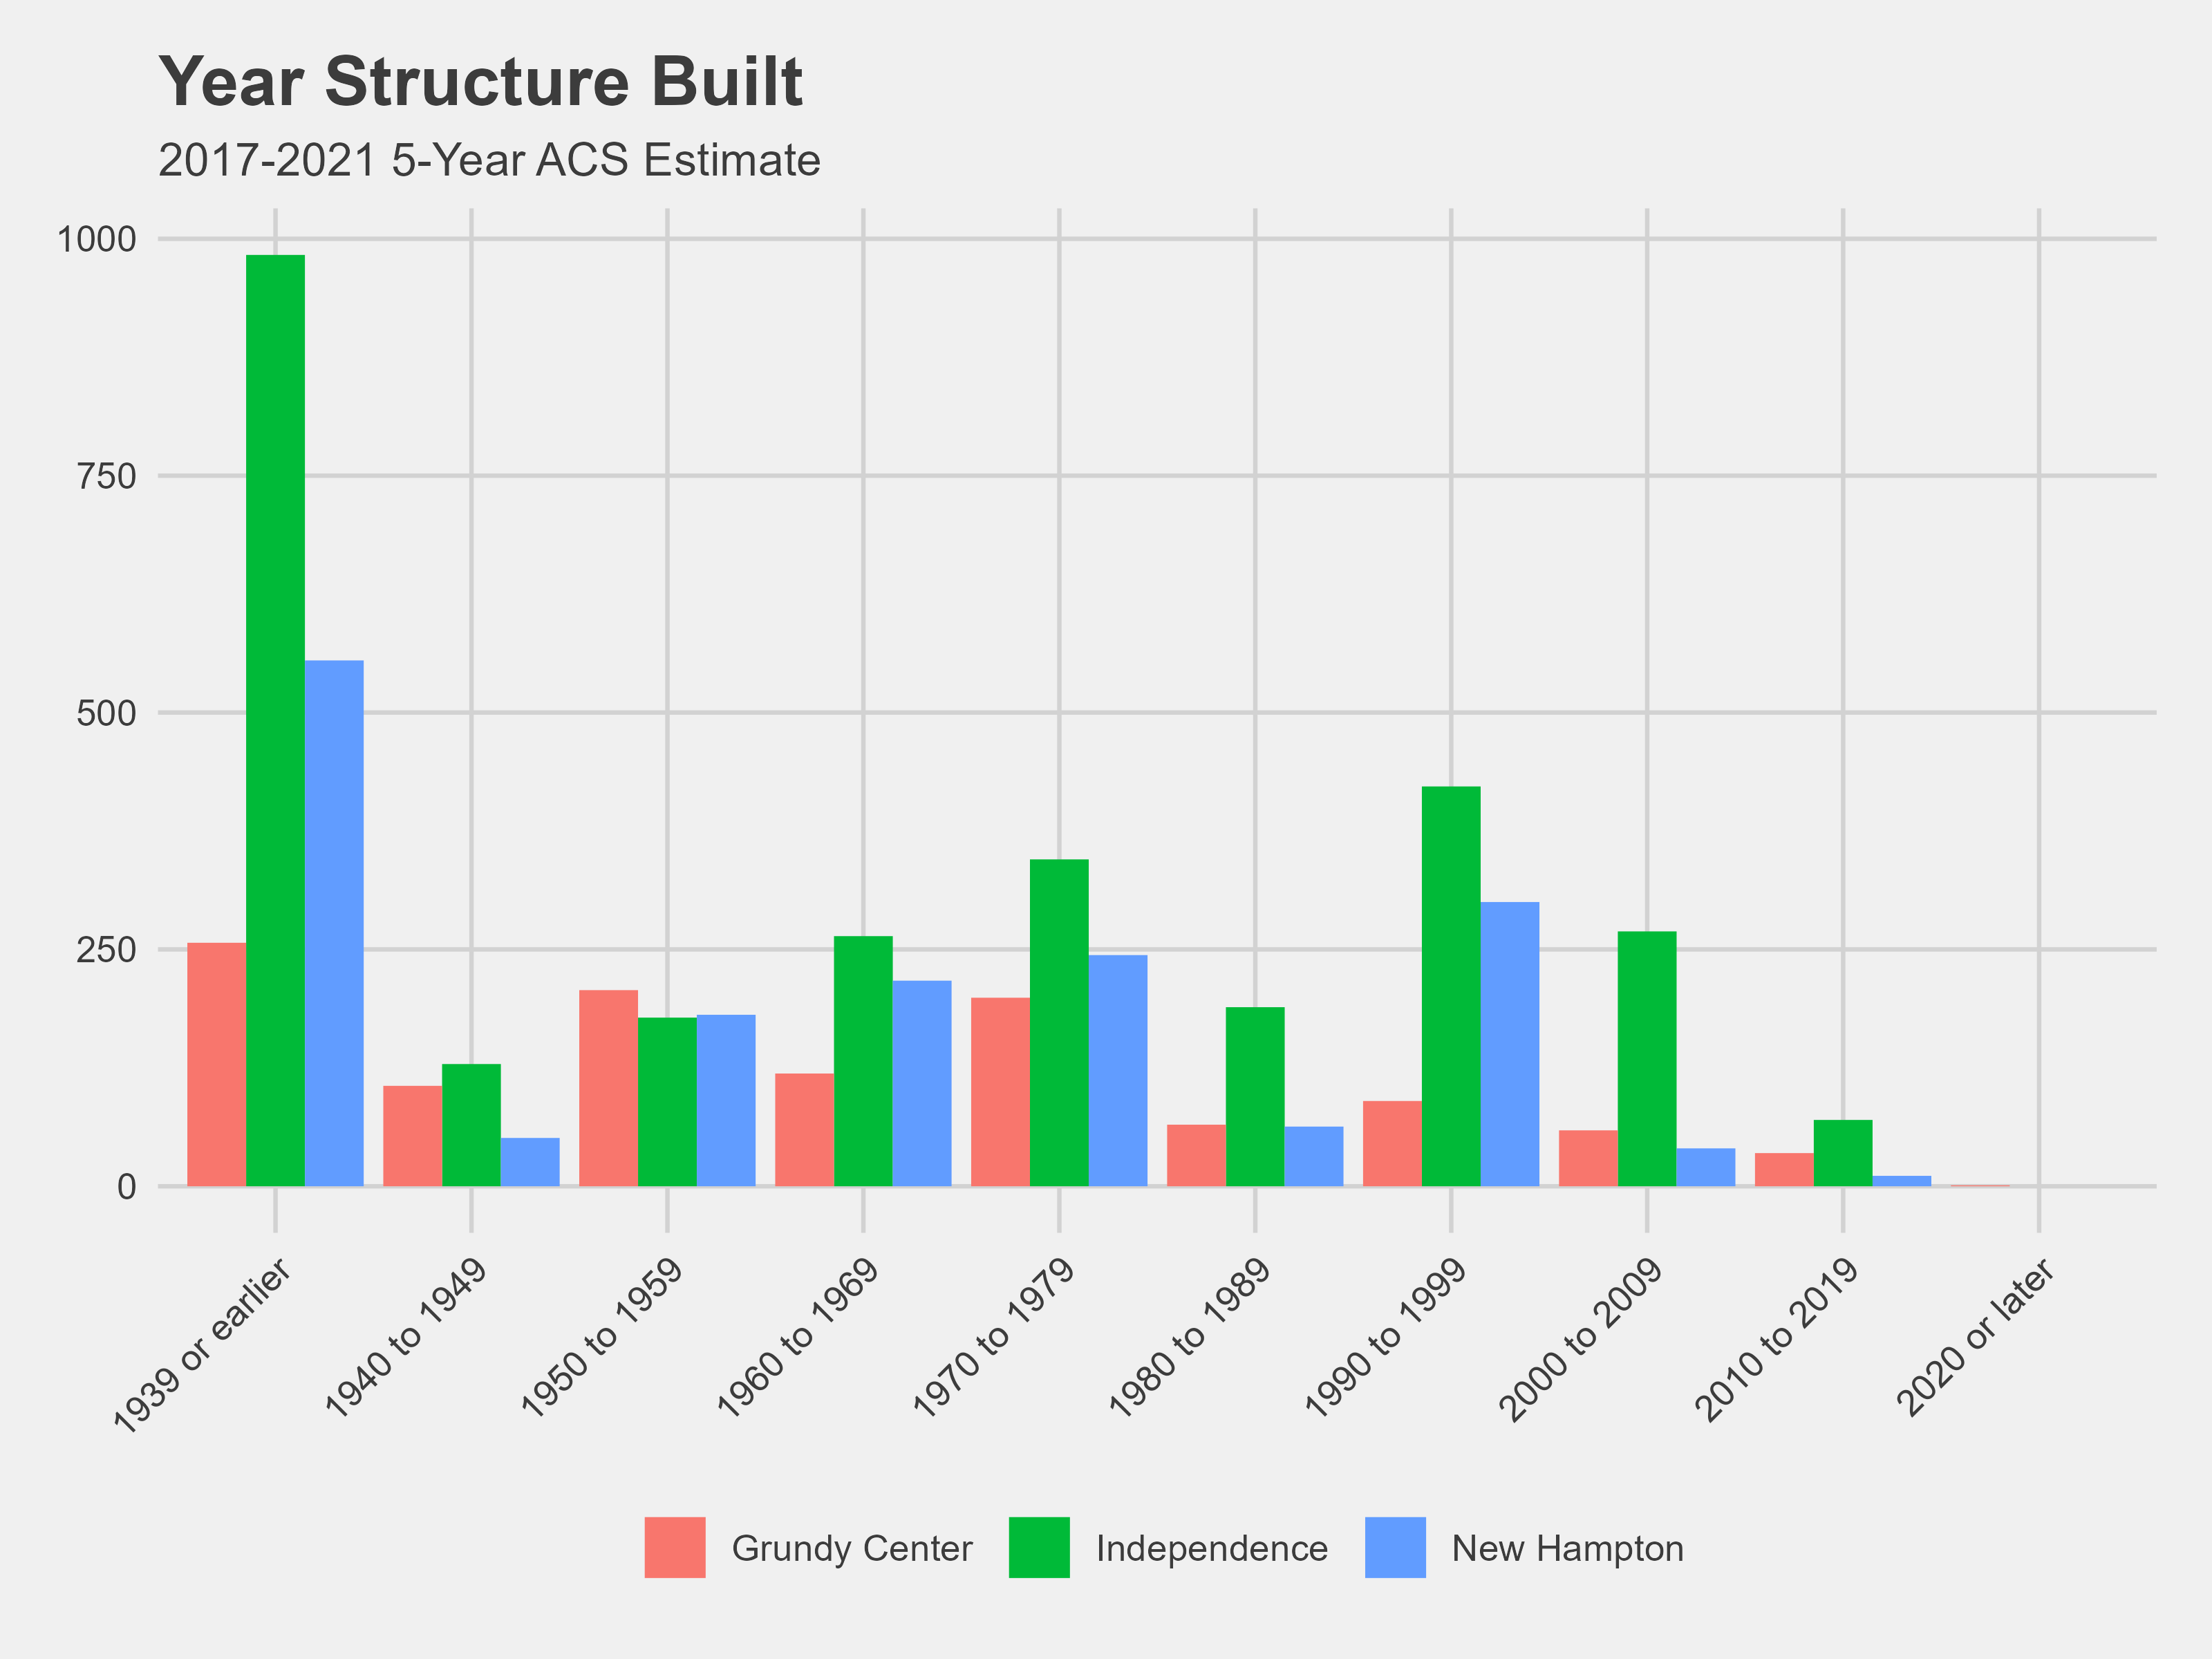
After our Friday meeting, I got some notes from Chris and other members of DSPG on my plots. They suggested I change some of my plots to display percentages instead of counts. This change will give a more accurate representation of the data.
I will be making these changes next week, and I will be starting the demographic analysis to determine which communities in Iowa could benefit from our project.